Dashboard Builder
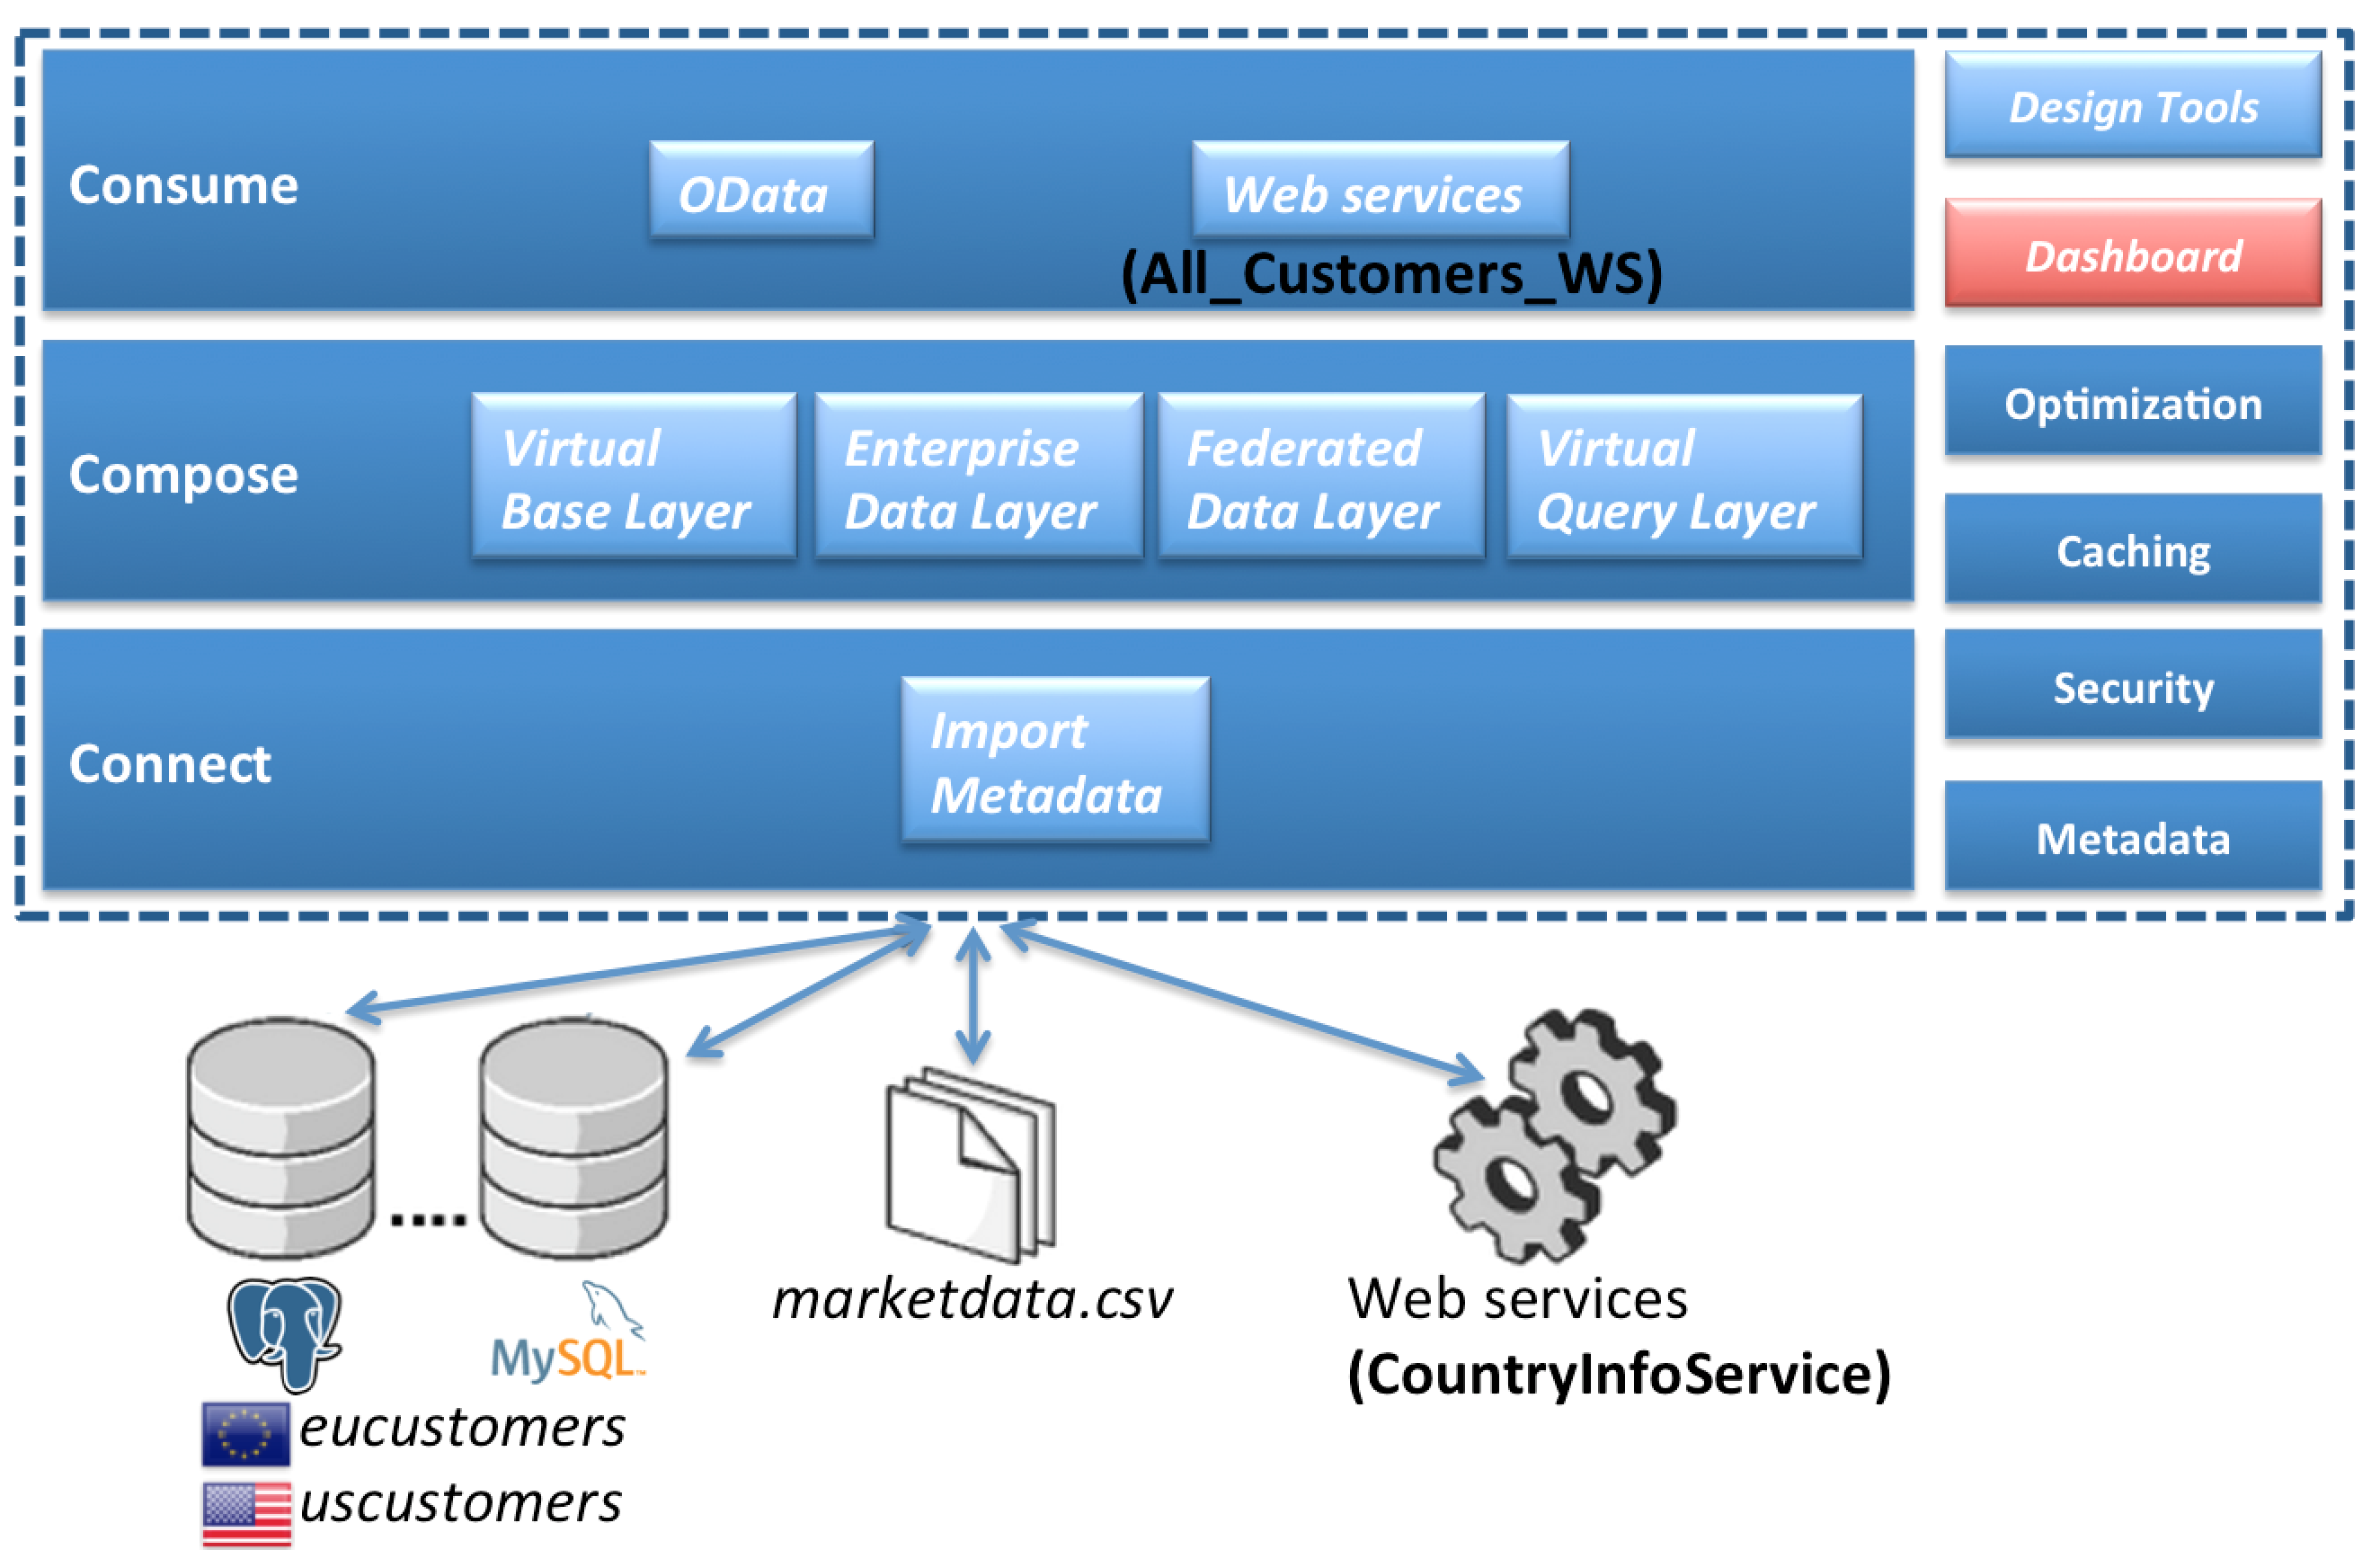
The Dashboard Builder is a full featured web application which allows non-technical users to visually create business dashboards. Dashboard data can be extracted from heterogeneous sources of information such as JDBC databases or regular text files. Some ready-to-use sample dashboards are provided for demo and learning purposes.
It features:
-
Visual configuration of dashboards (Drag & Drop).
-
Graphical representation of KPIs (Key Performance Indicators).
-
Configuration of interactive report tables.
-
Data export to Excel and CSV format.
-
Filtering and search, both in-memory or SQL based.
-
Data extraction from external systems, through different protocols.
-
Granular access control for different user profiles.
-
Look and feel customization tools.
-
Pluggable chart library architecture.
Where are we?
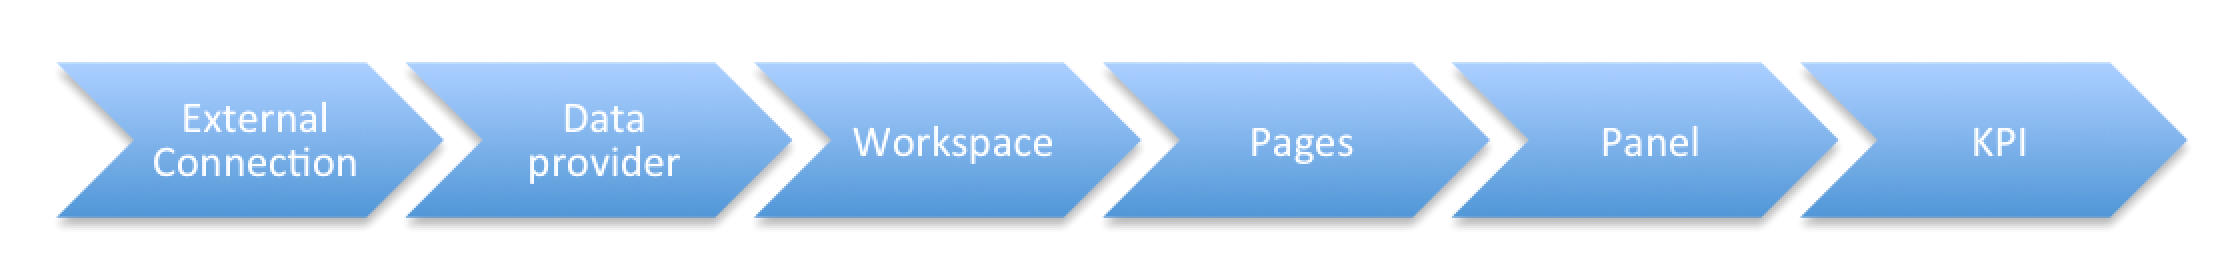
Dashboard Builder Workflow
We are creating a Financial Dashboard based on the models of the Federated Data Layer. The steps of creating a dashboard is described below:
-
First we need to define an external connection which can be either a flat file or a database
-
Next step is to create a data provider based on the external connection. The data provider contains the definition of the data to be displayed in the dashboard.
-
A dashboard in Dashboard Builder contains one or more Workspaces
-
Each Workspace contains one or more Pages
-
Each Page contains one or more Panels
-
Each Panel is connected to a component
-
There are three component categories
-
Dashboard (I.e. HTML editor, KPI)
-
Navigation (I.e. Tree menu, Bread crumb, Logout panel…)
-
System (I.e. System related components like Data source manager…)
-
How this is accomplished in Dashboard Builder
-
Start Dashboard Builder
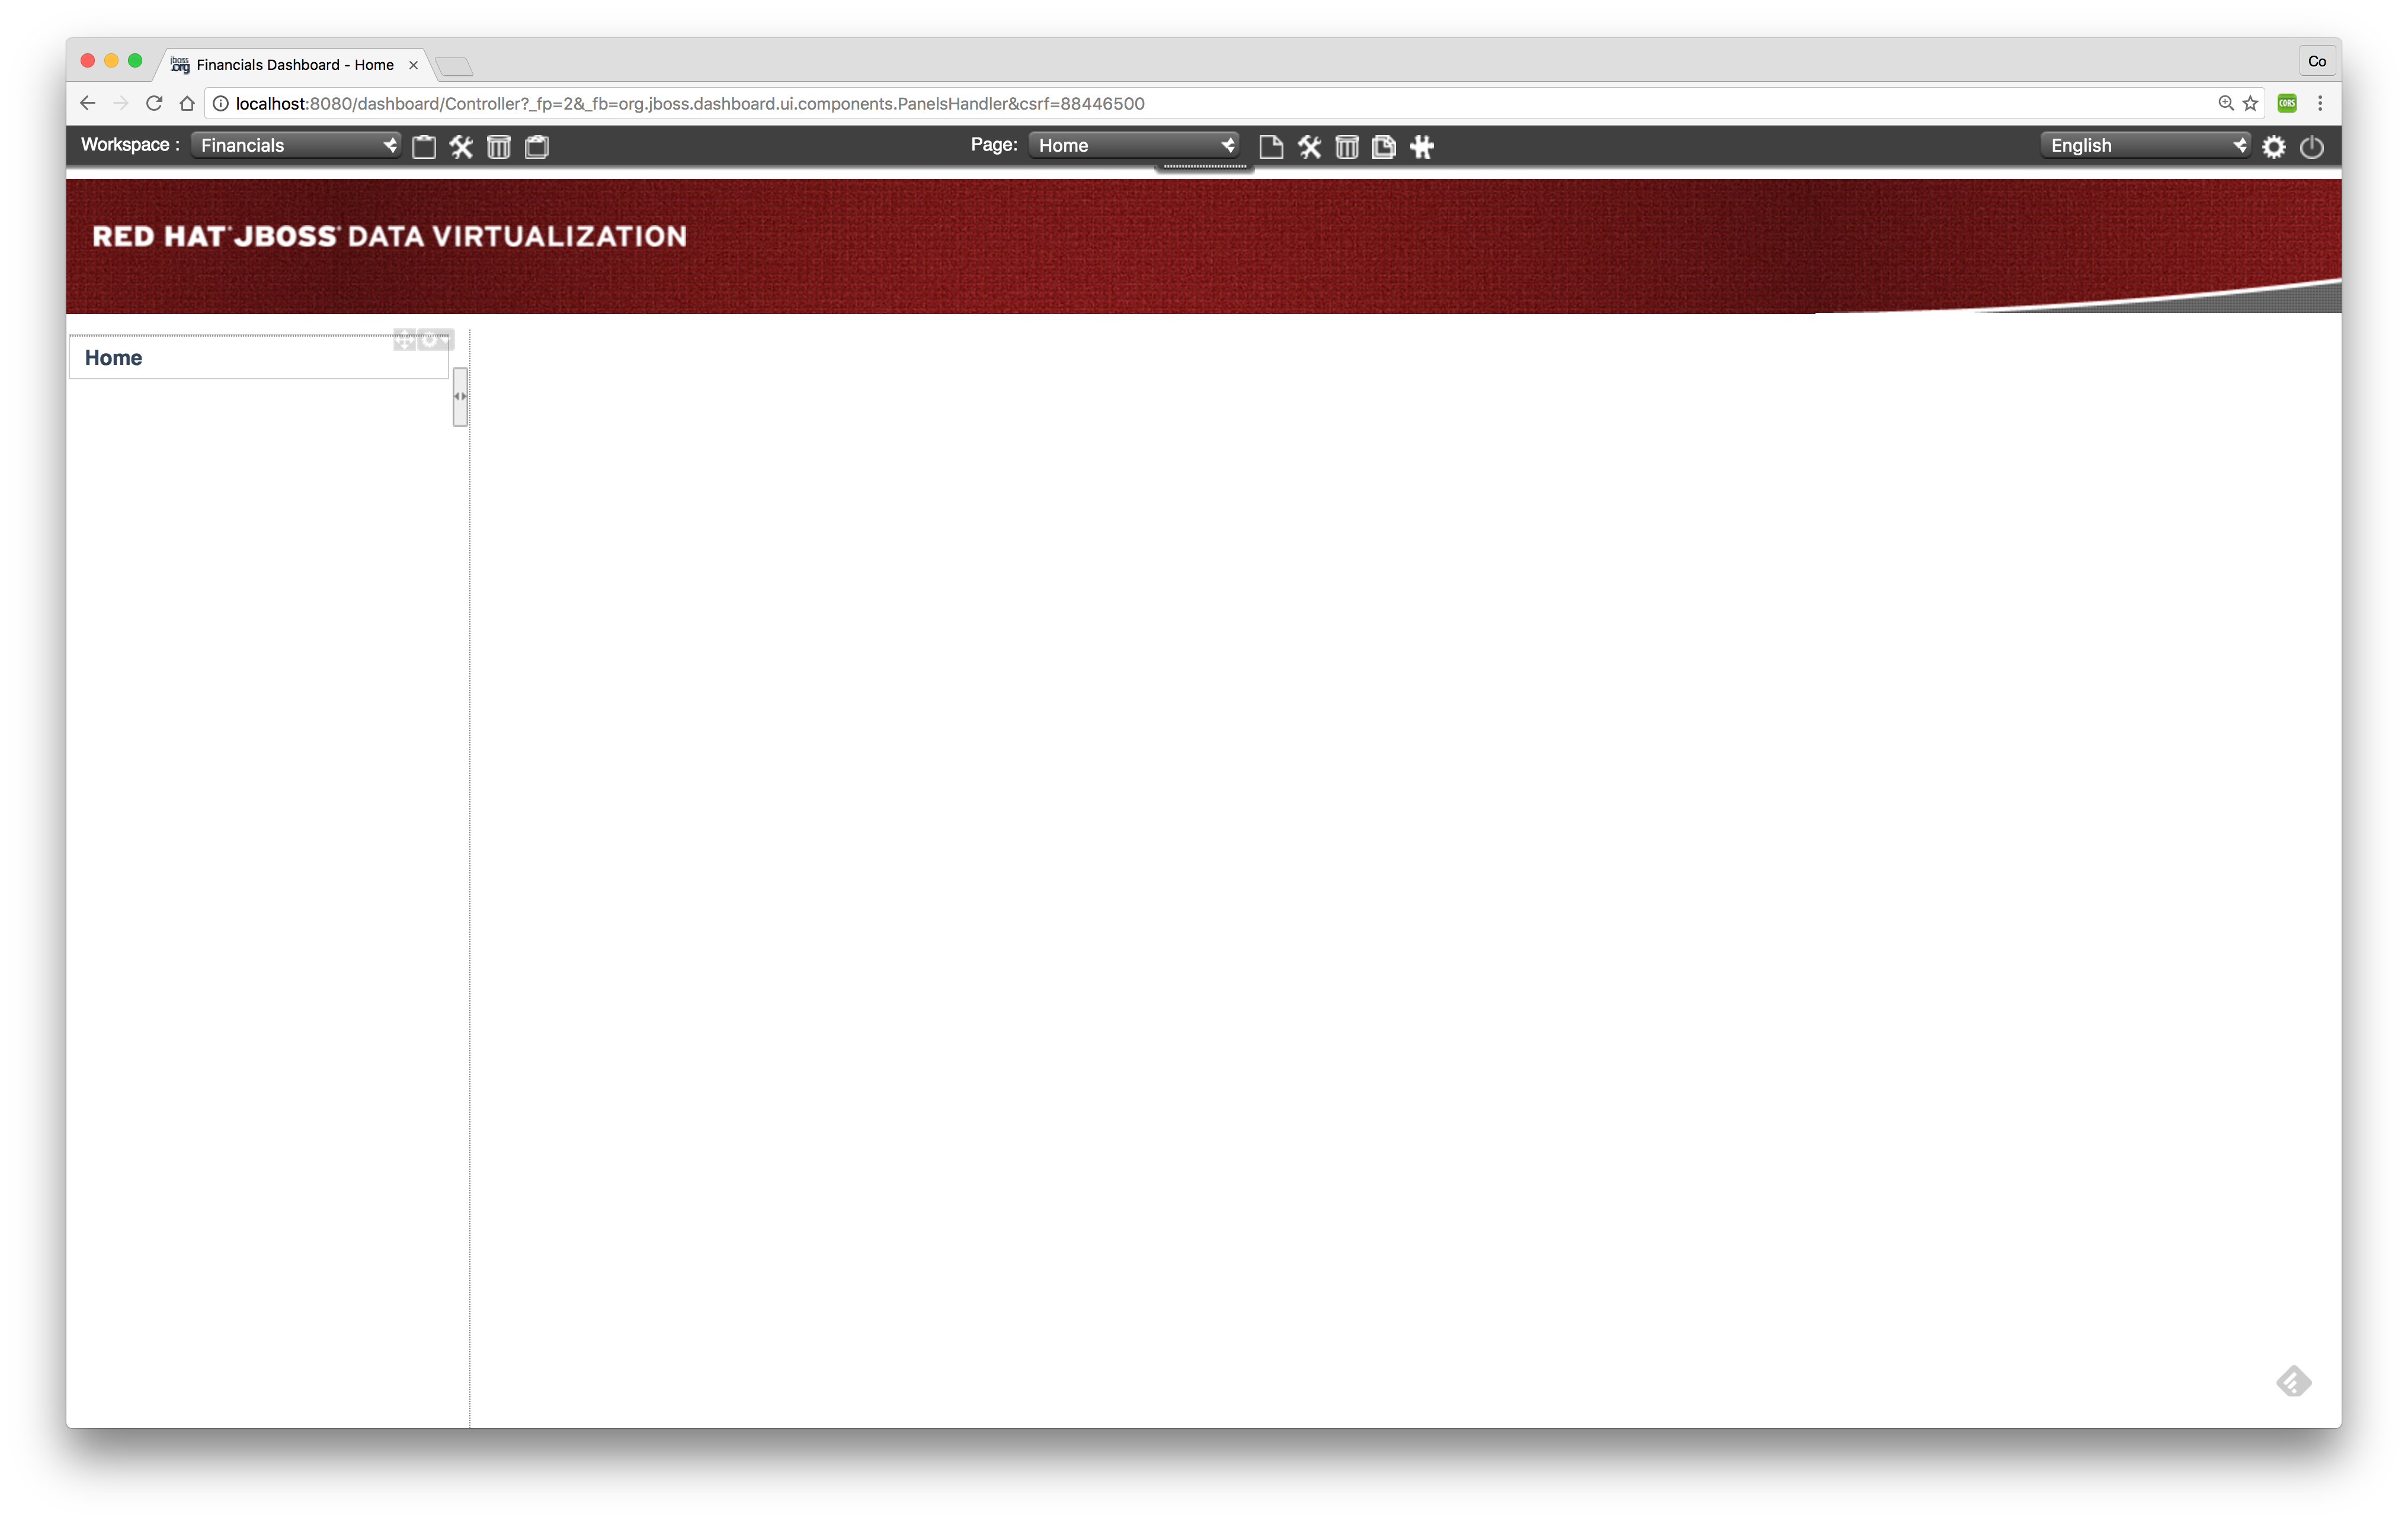
Go to a browser window and type in the following URL
http://localhost:8080/dashboard and you should see the following screen:

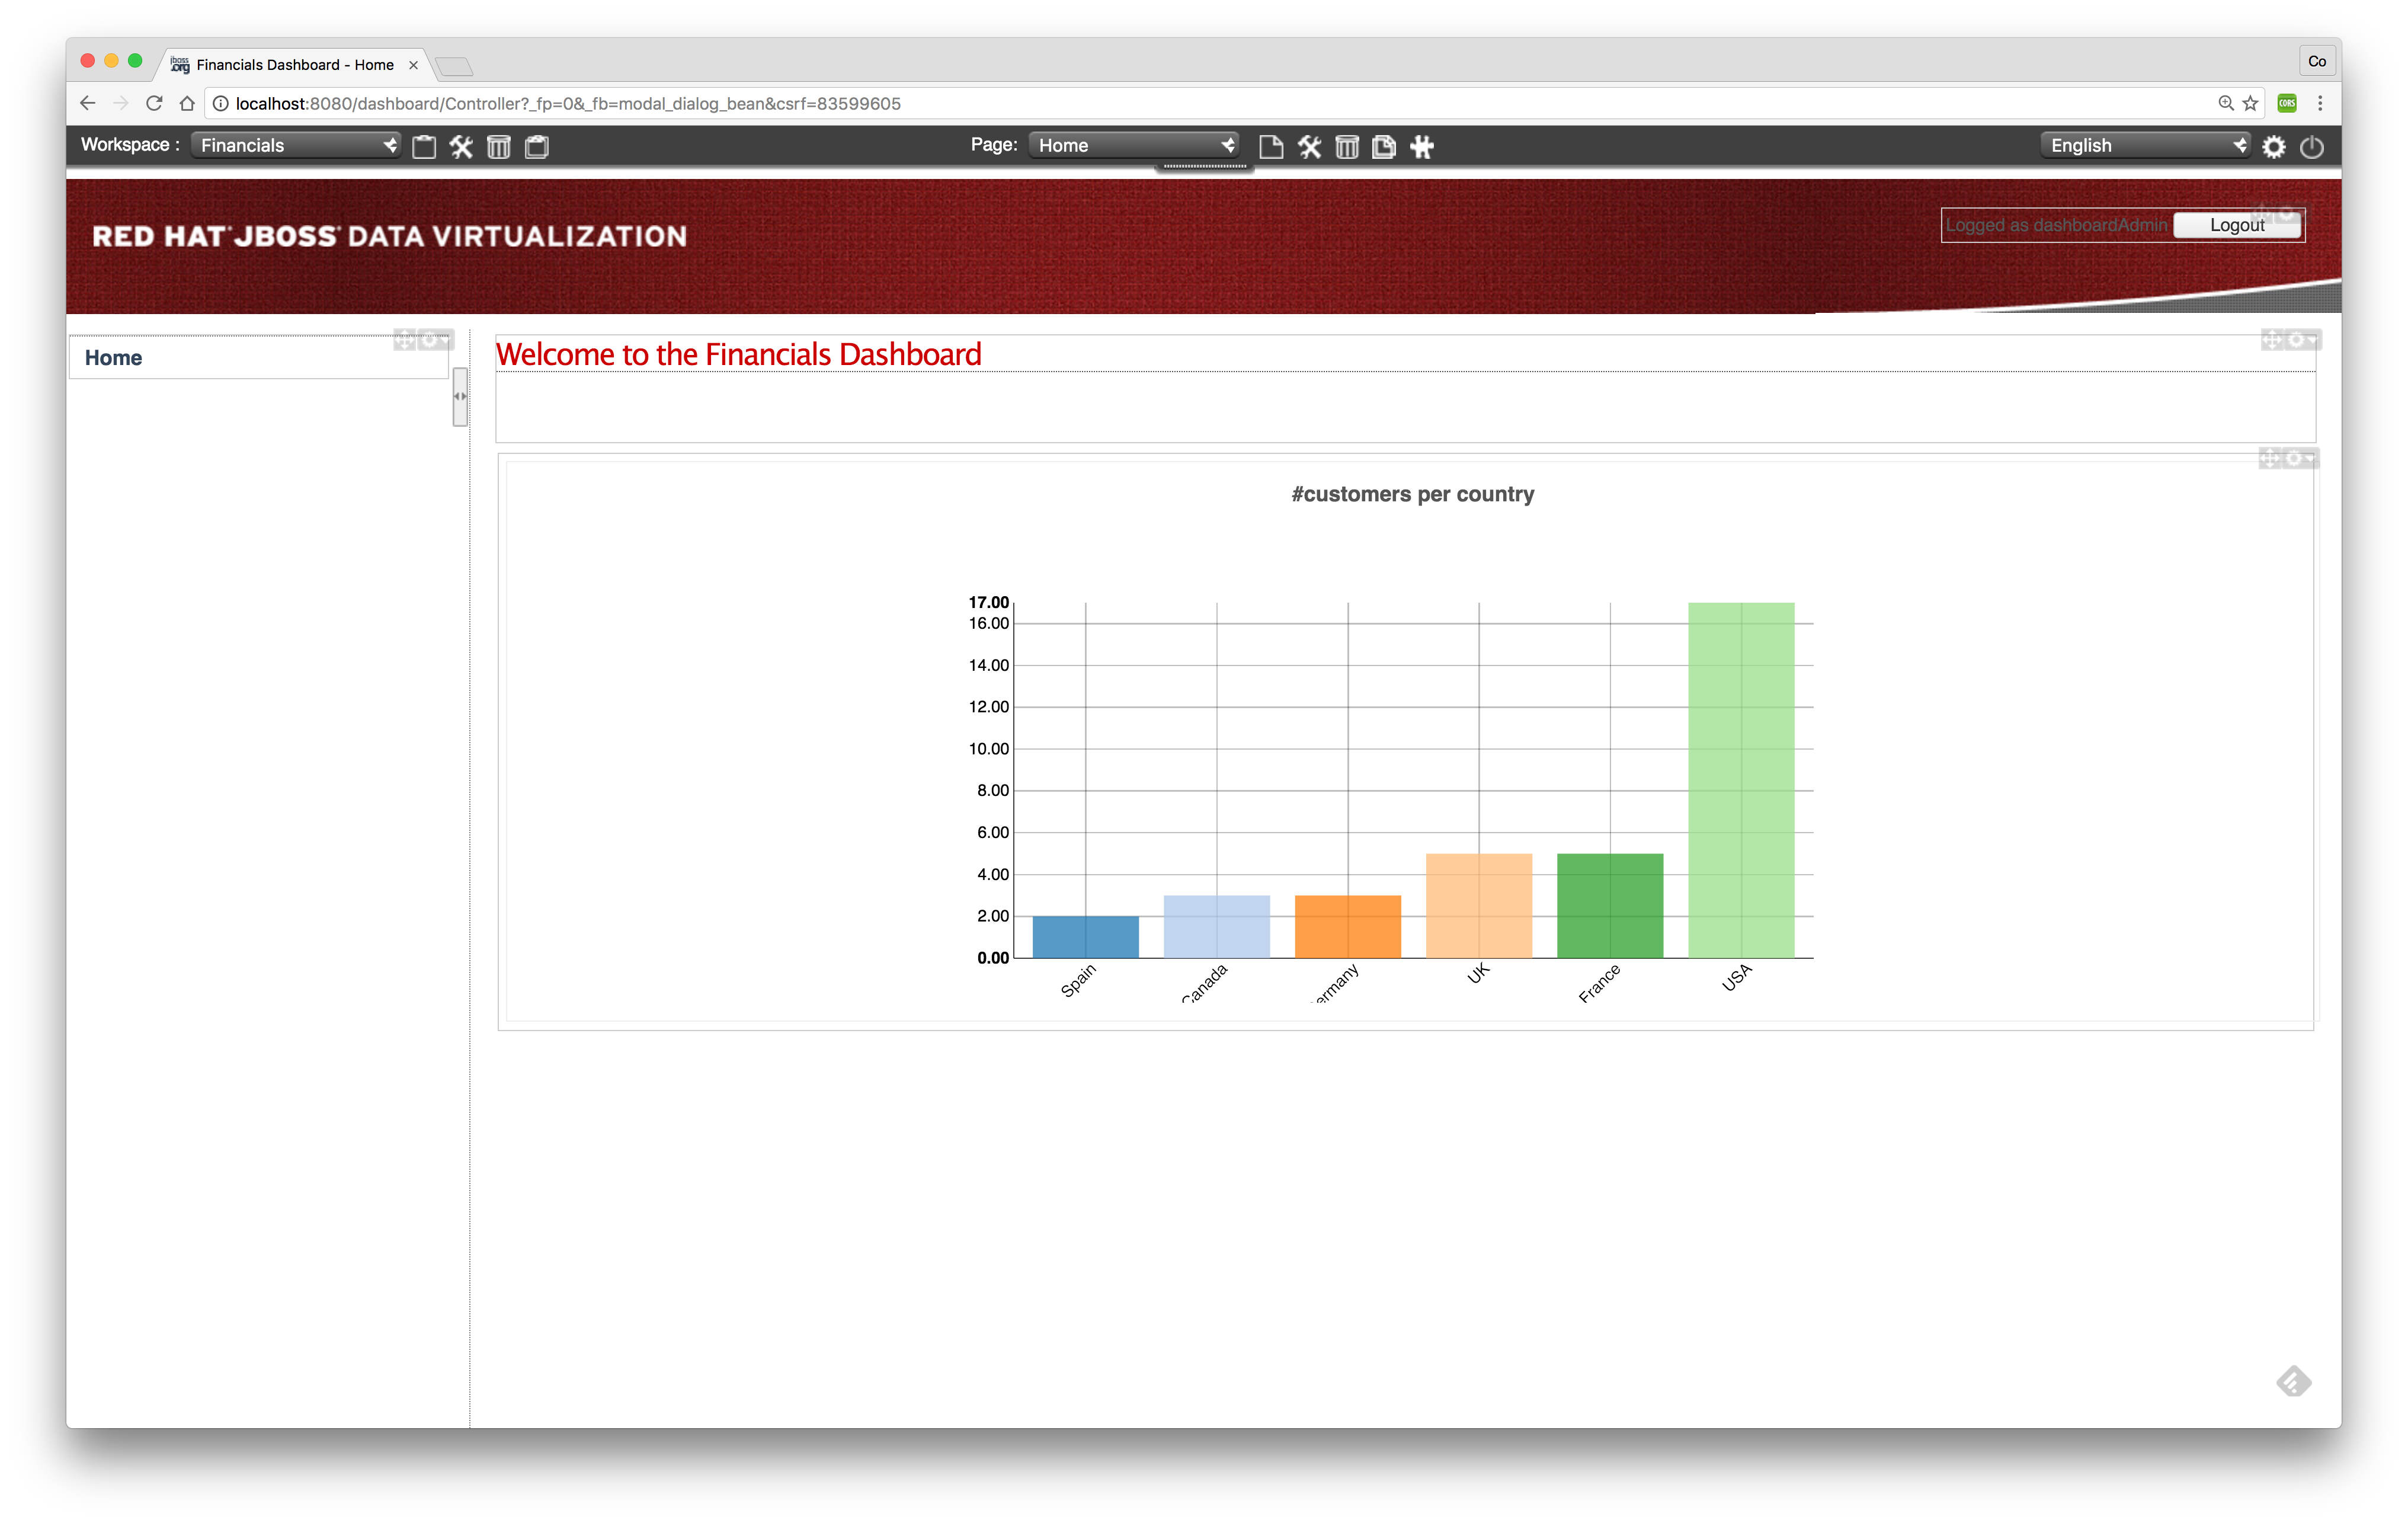
Login with username/password: dashboardAdmin/redhat1!
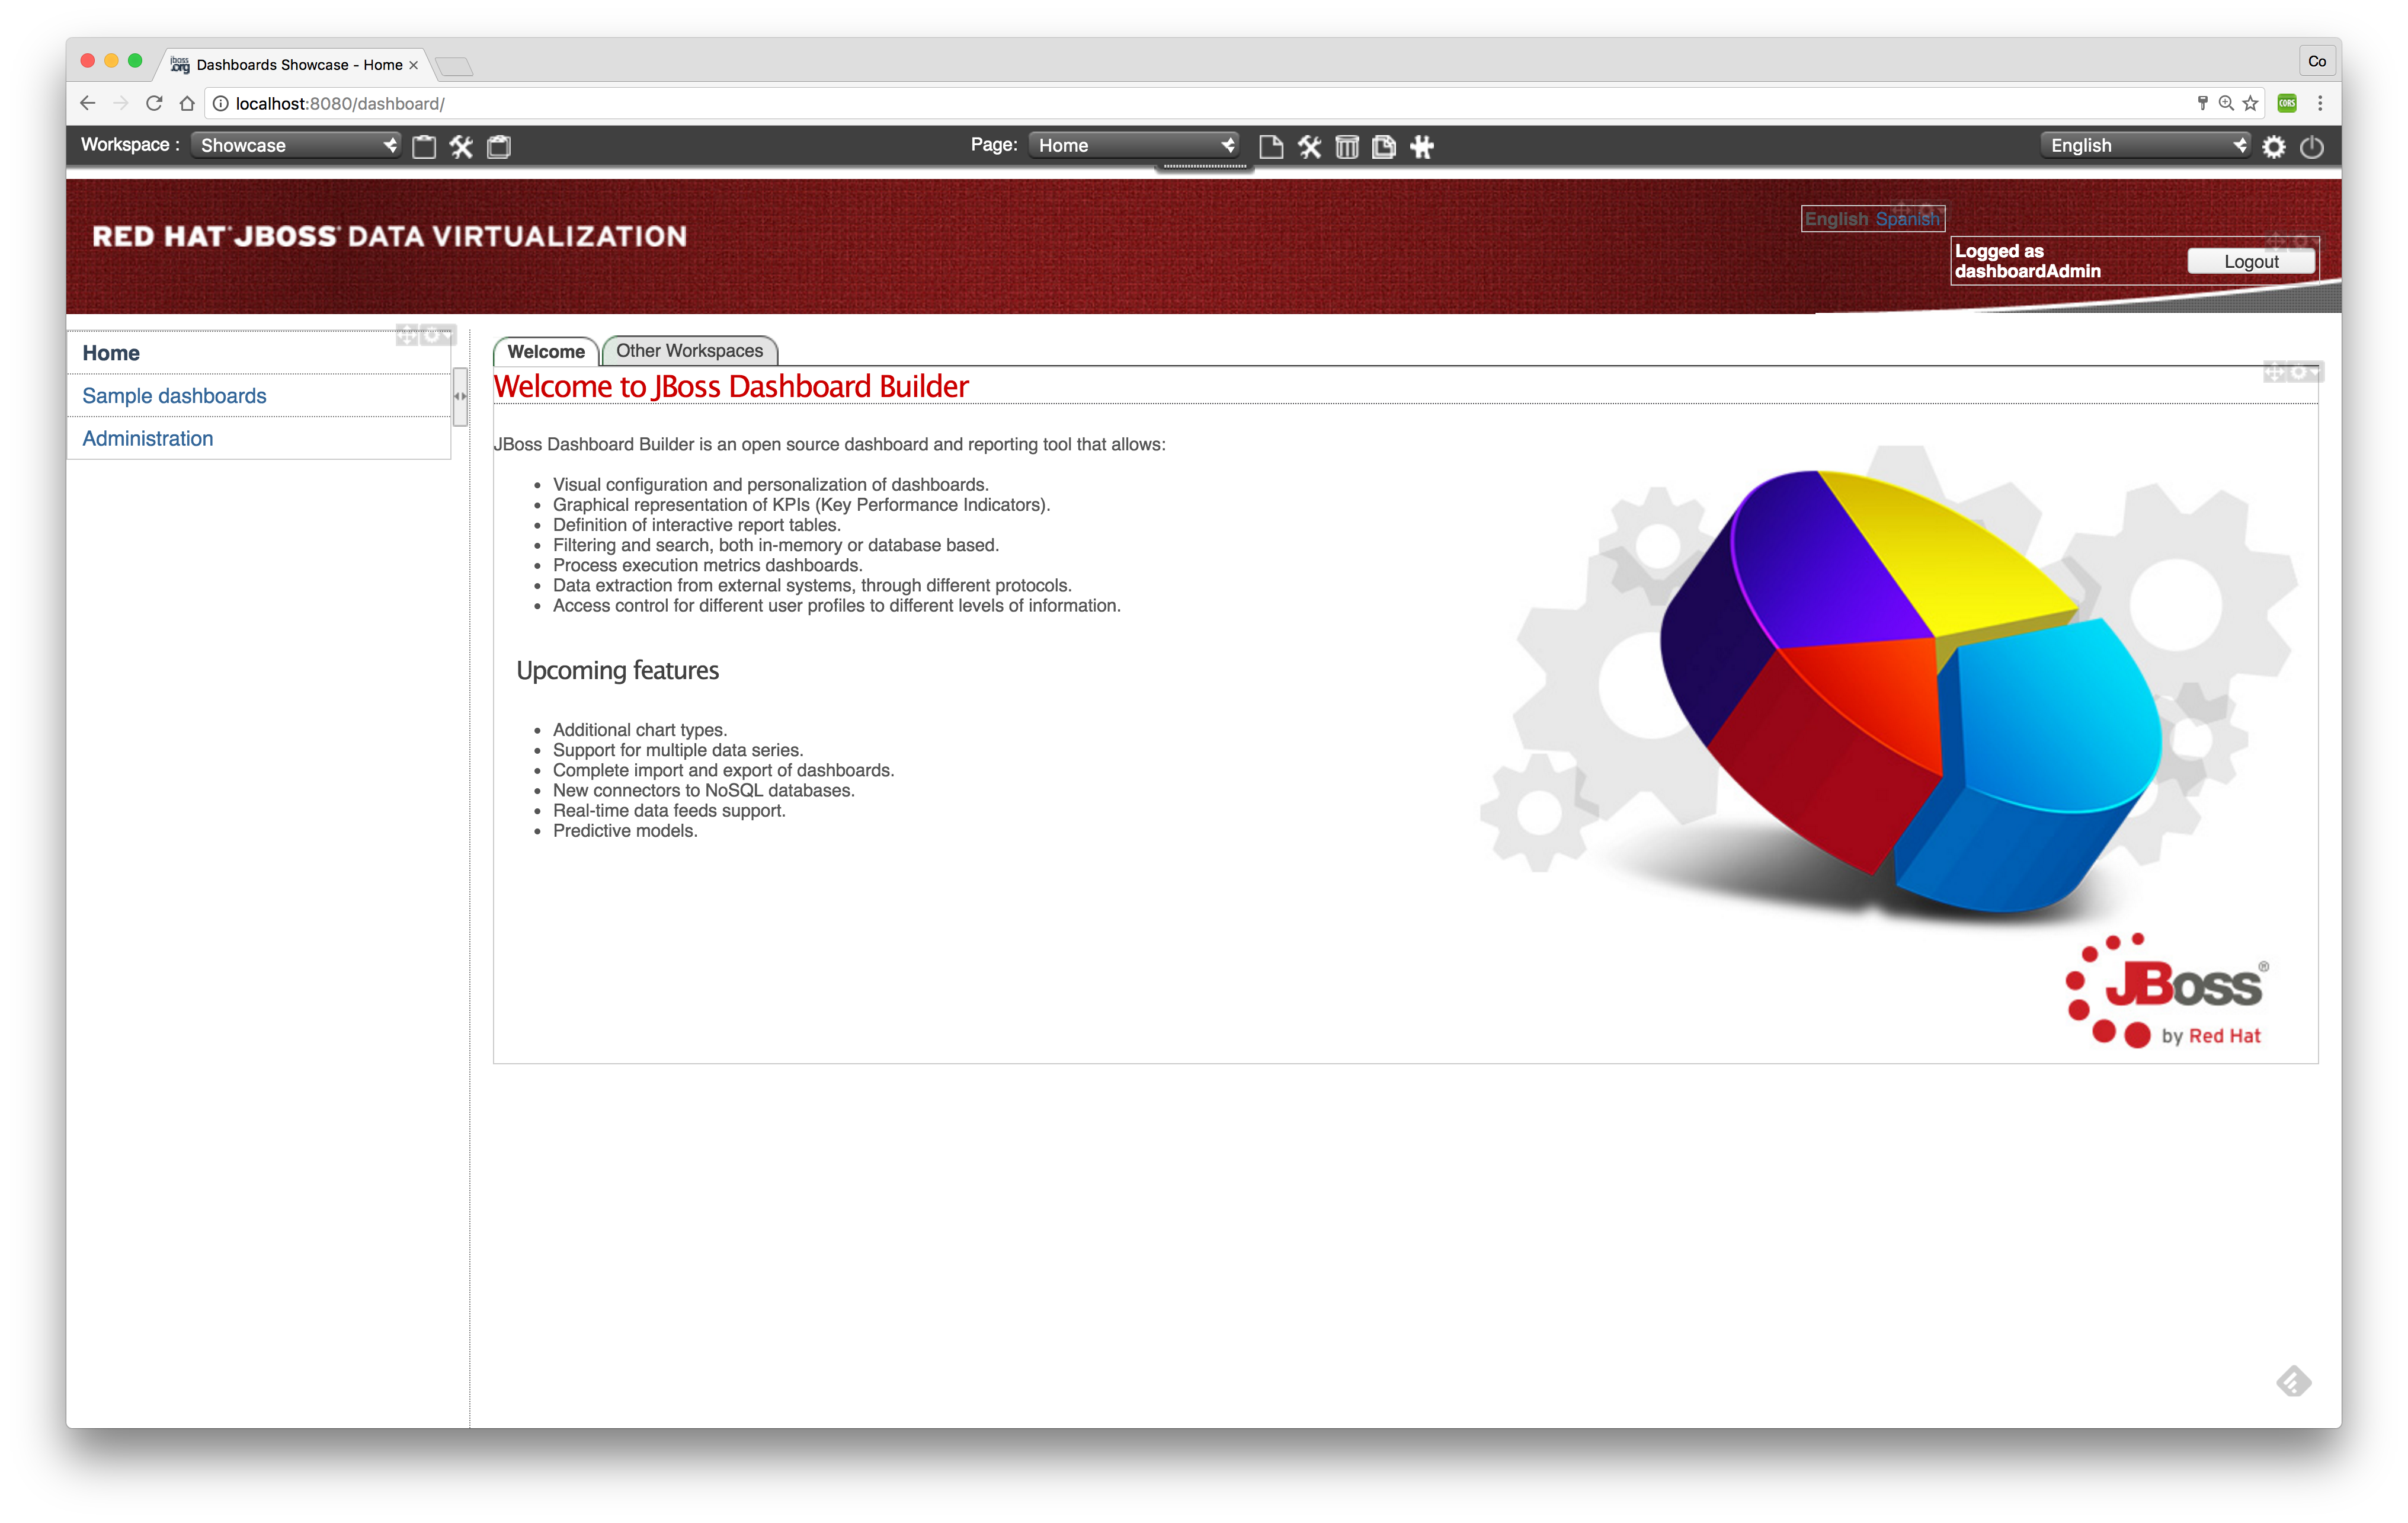
By default we provide some sample dashboards in the dashboard. Have a look at these sample dashboards first before creating your own dashboard.
-
Create an external connection
First we are going to create an external connection to be able to get the Financial data into the dashboard.
|
Note
|
Make sure that the Showcase workspace is the selected workspace. See top-left corner in picture above. |
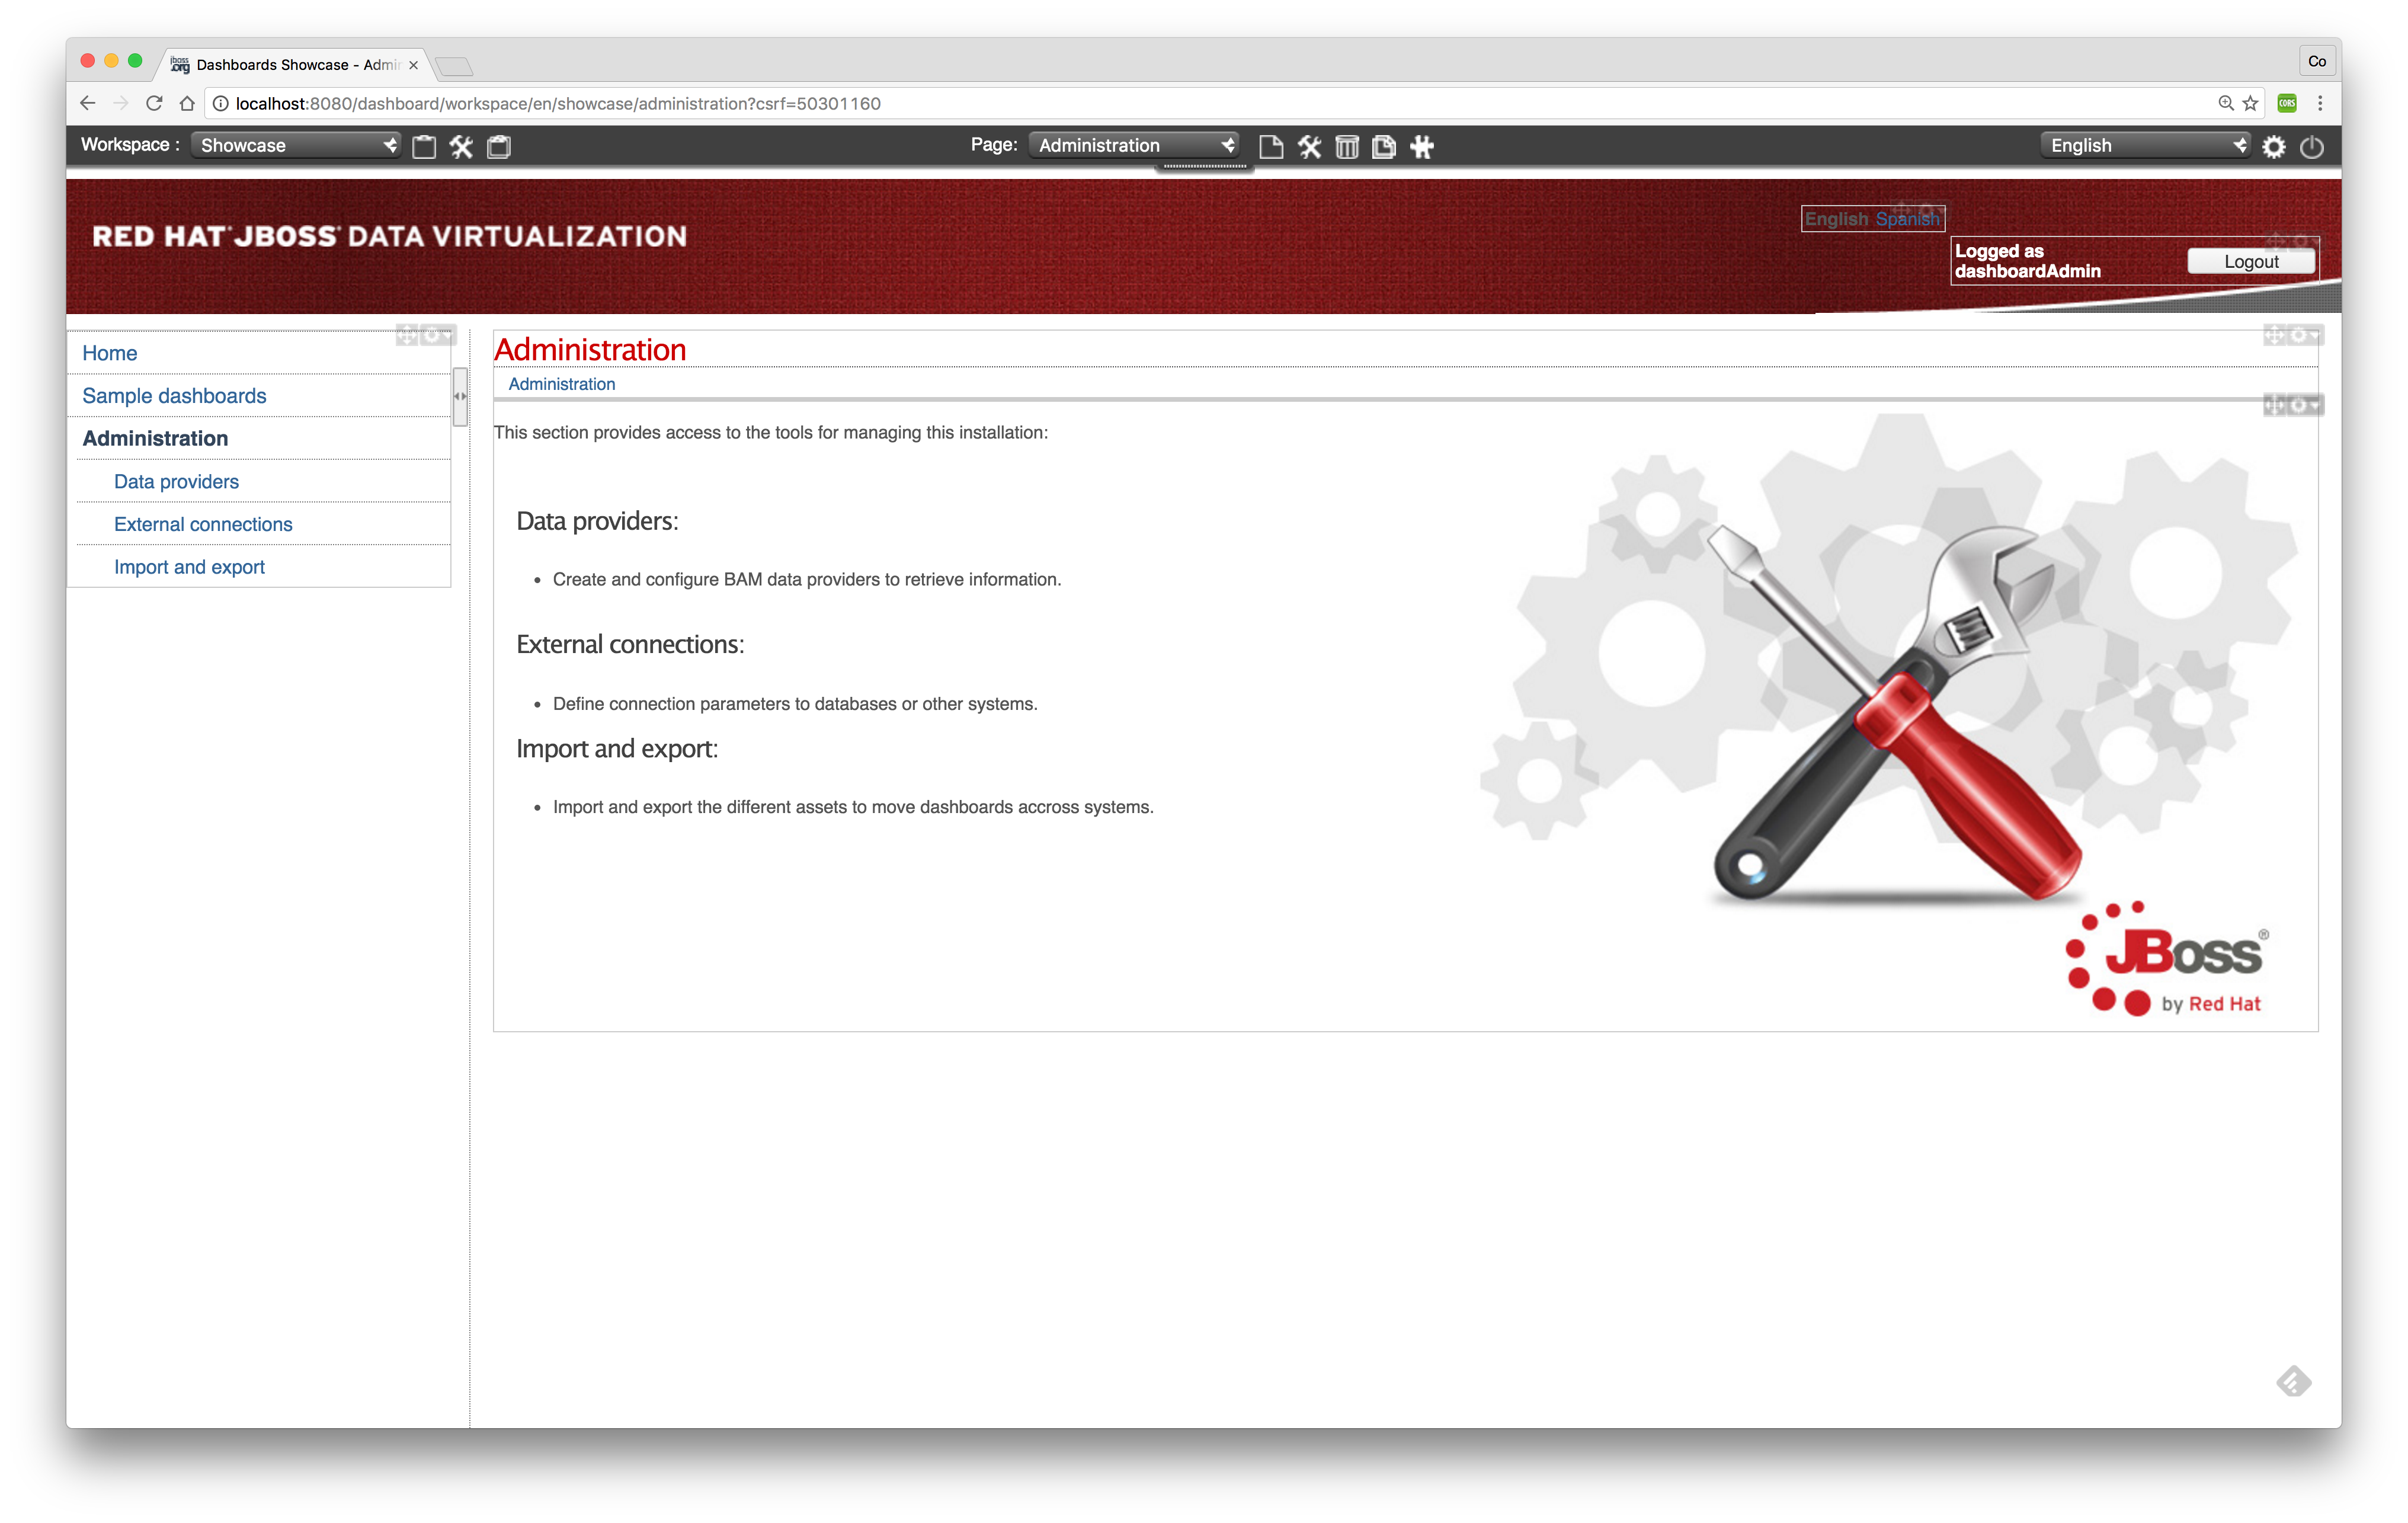
Select the following menu option menu:Administration[External connections] and the following screen should appear.
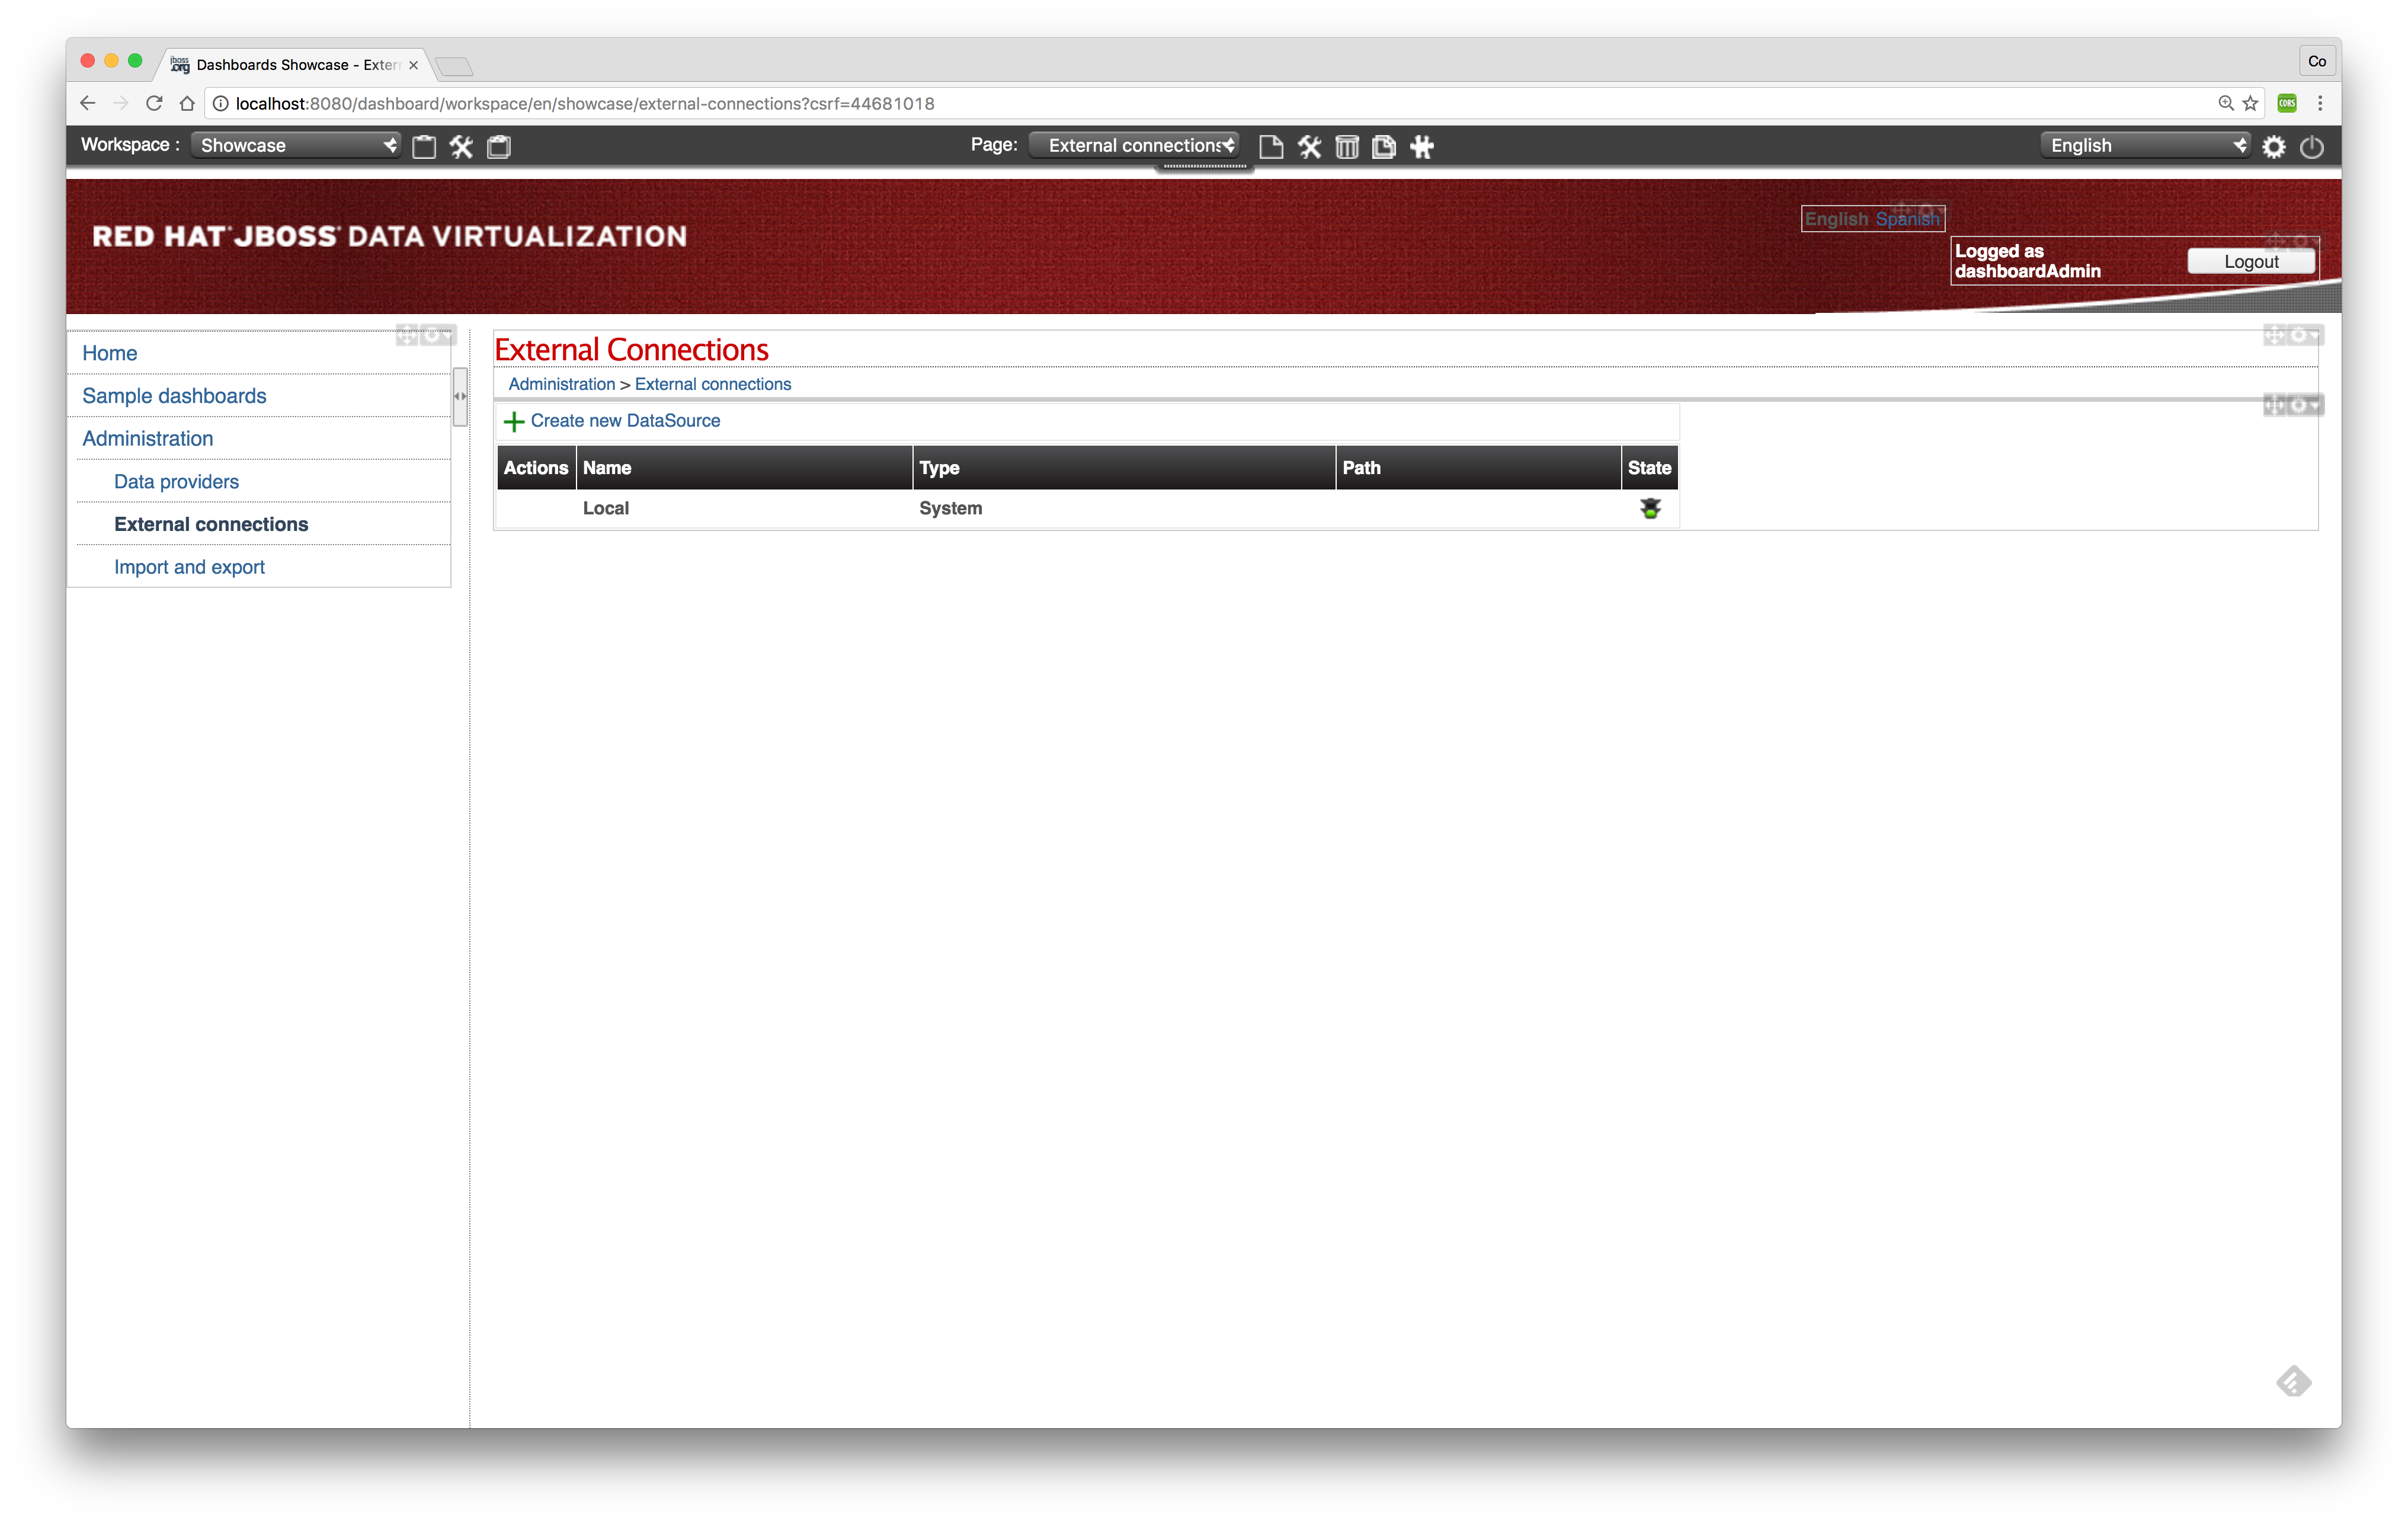
Now we have to add a new external connection. Click the btn:[+ Create new DataSource].
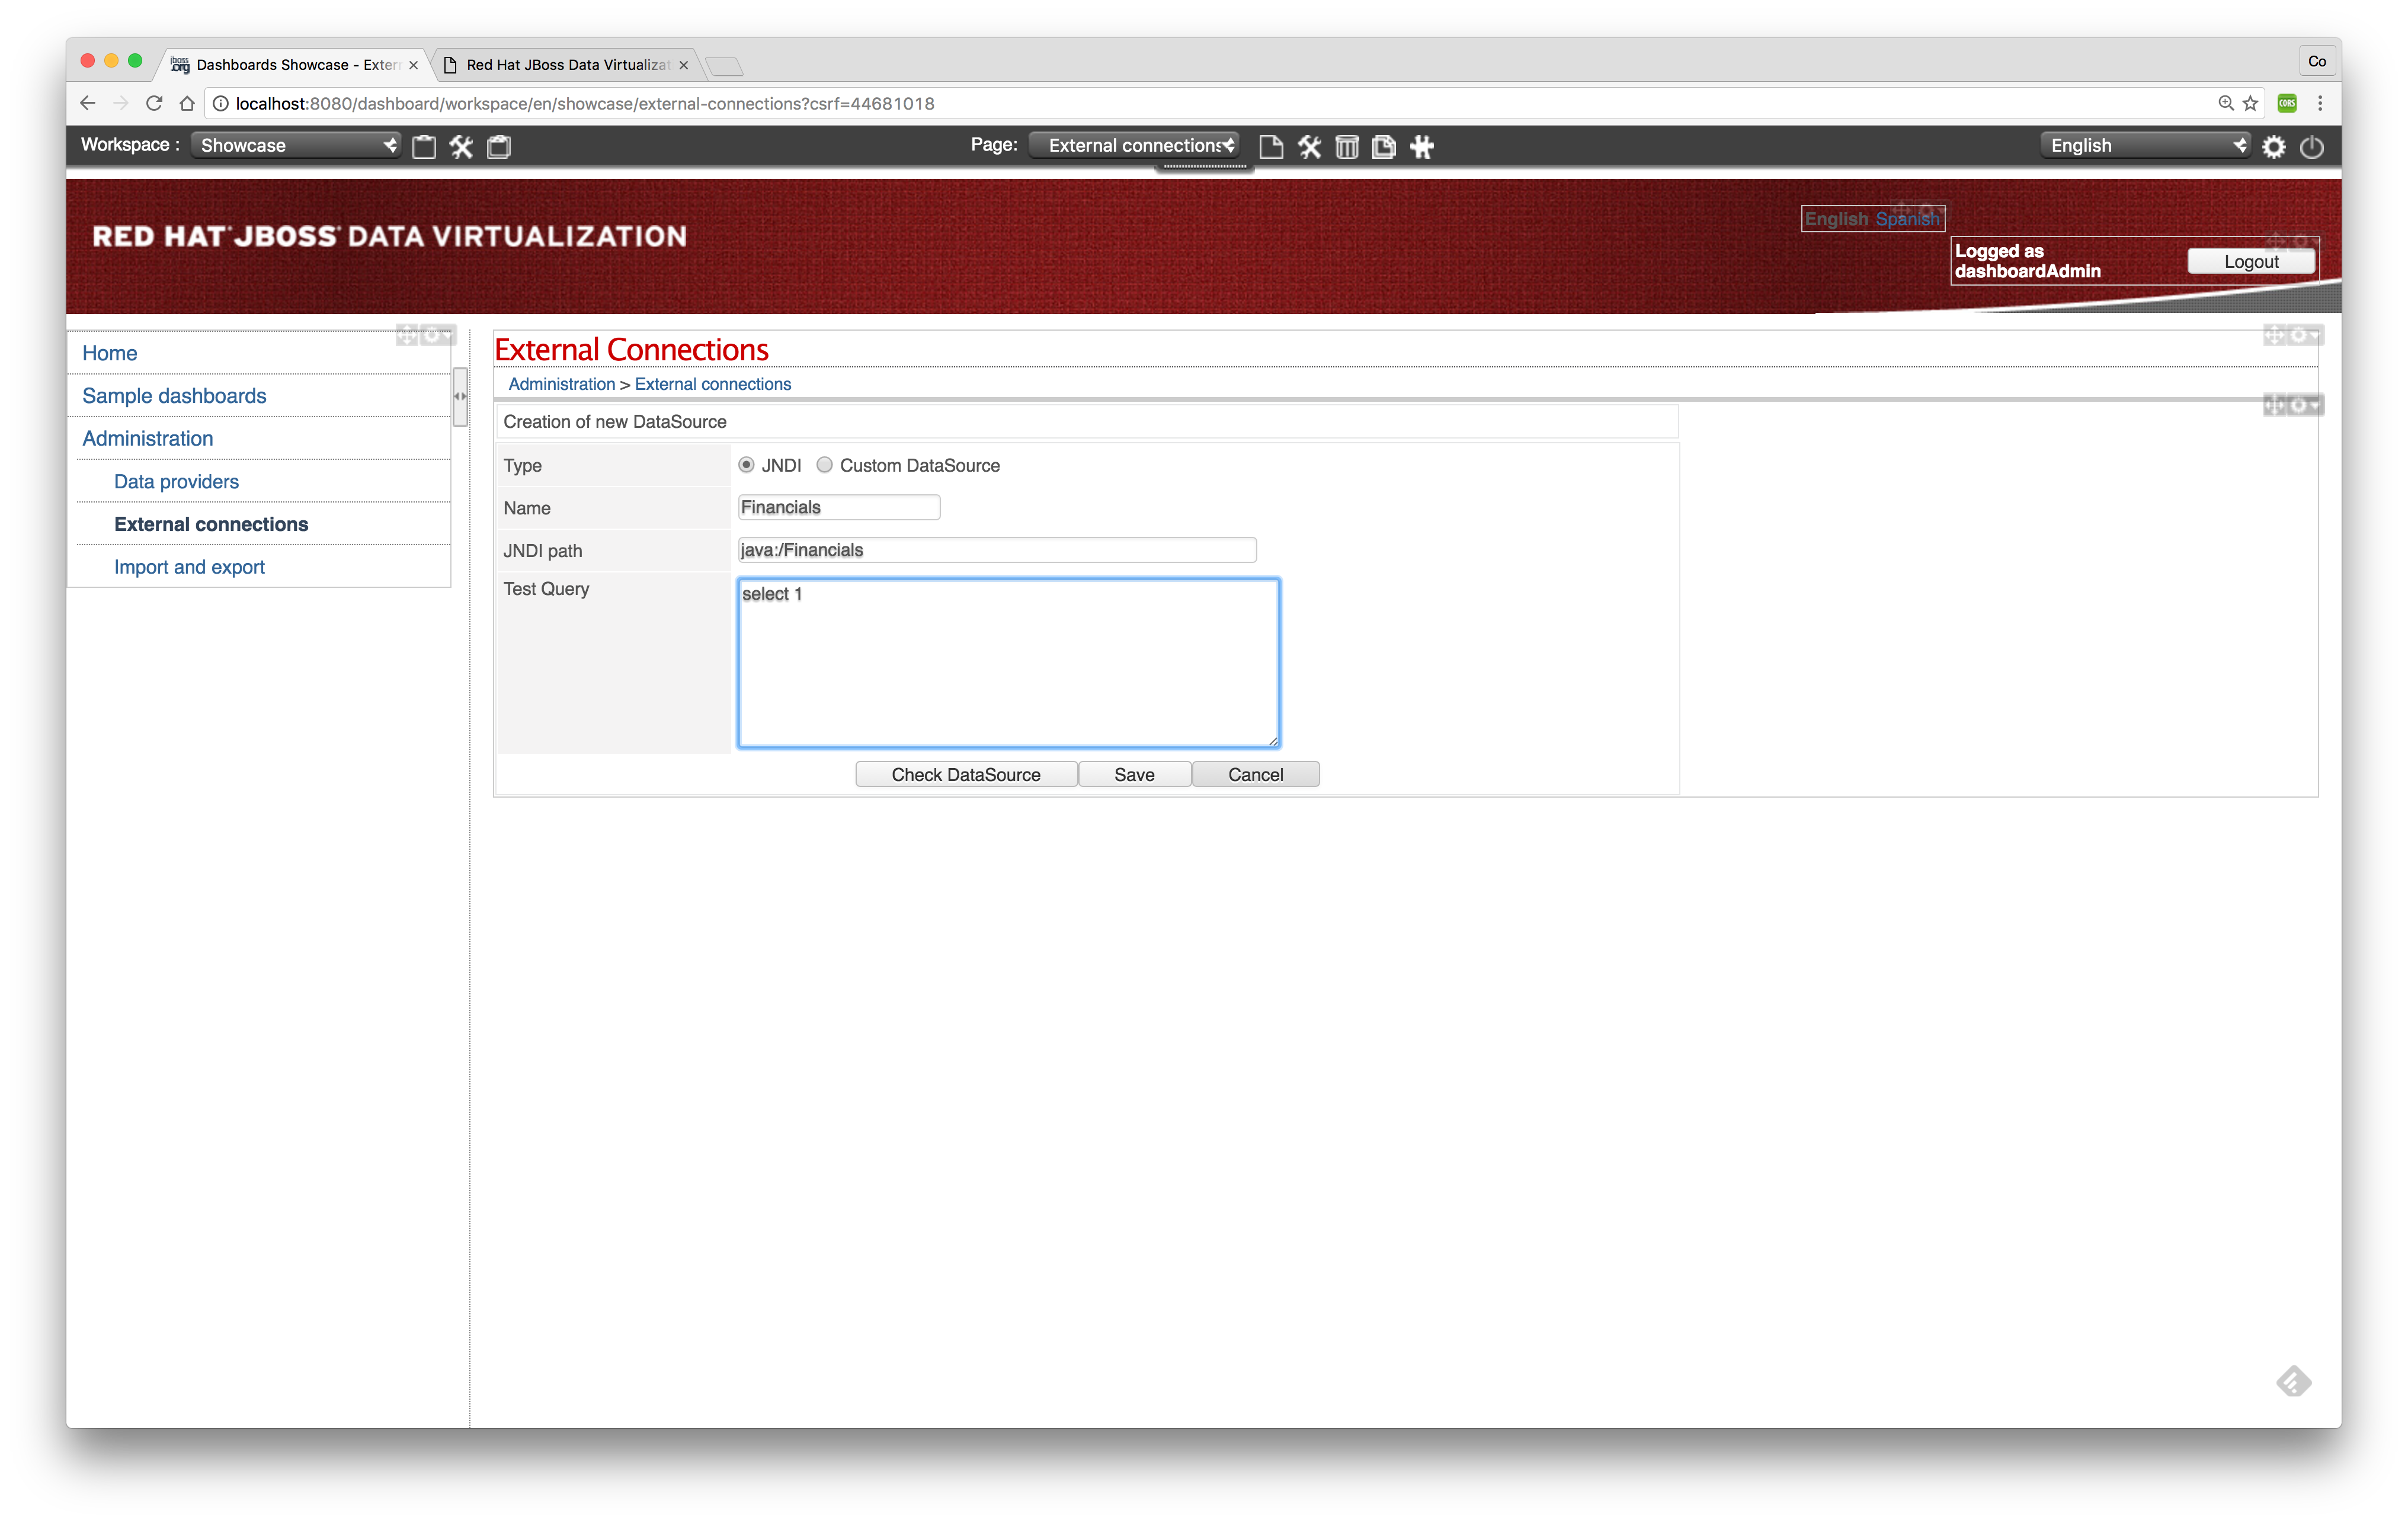
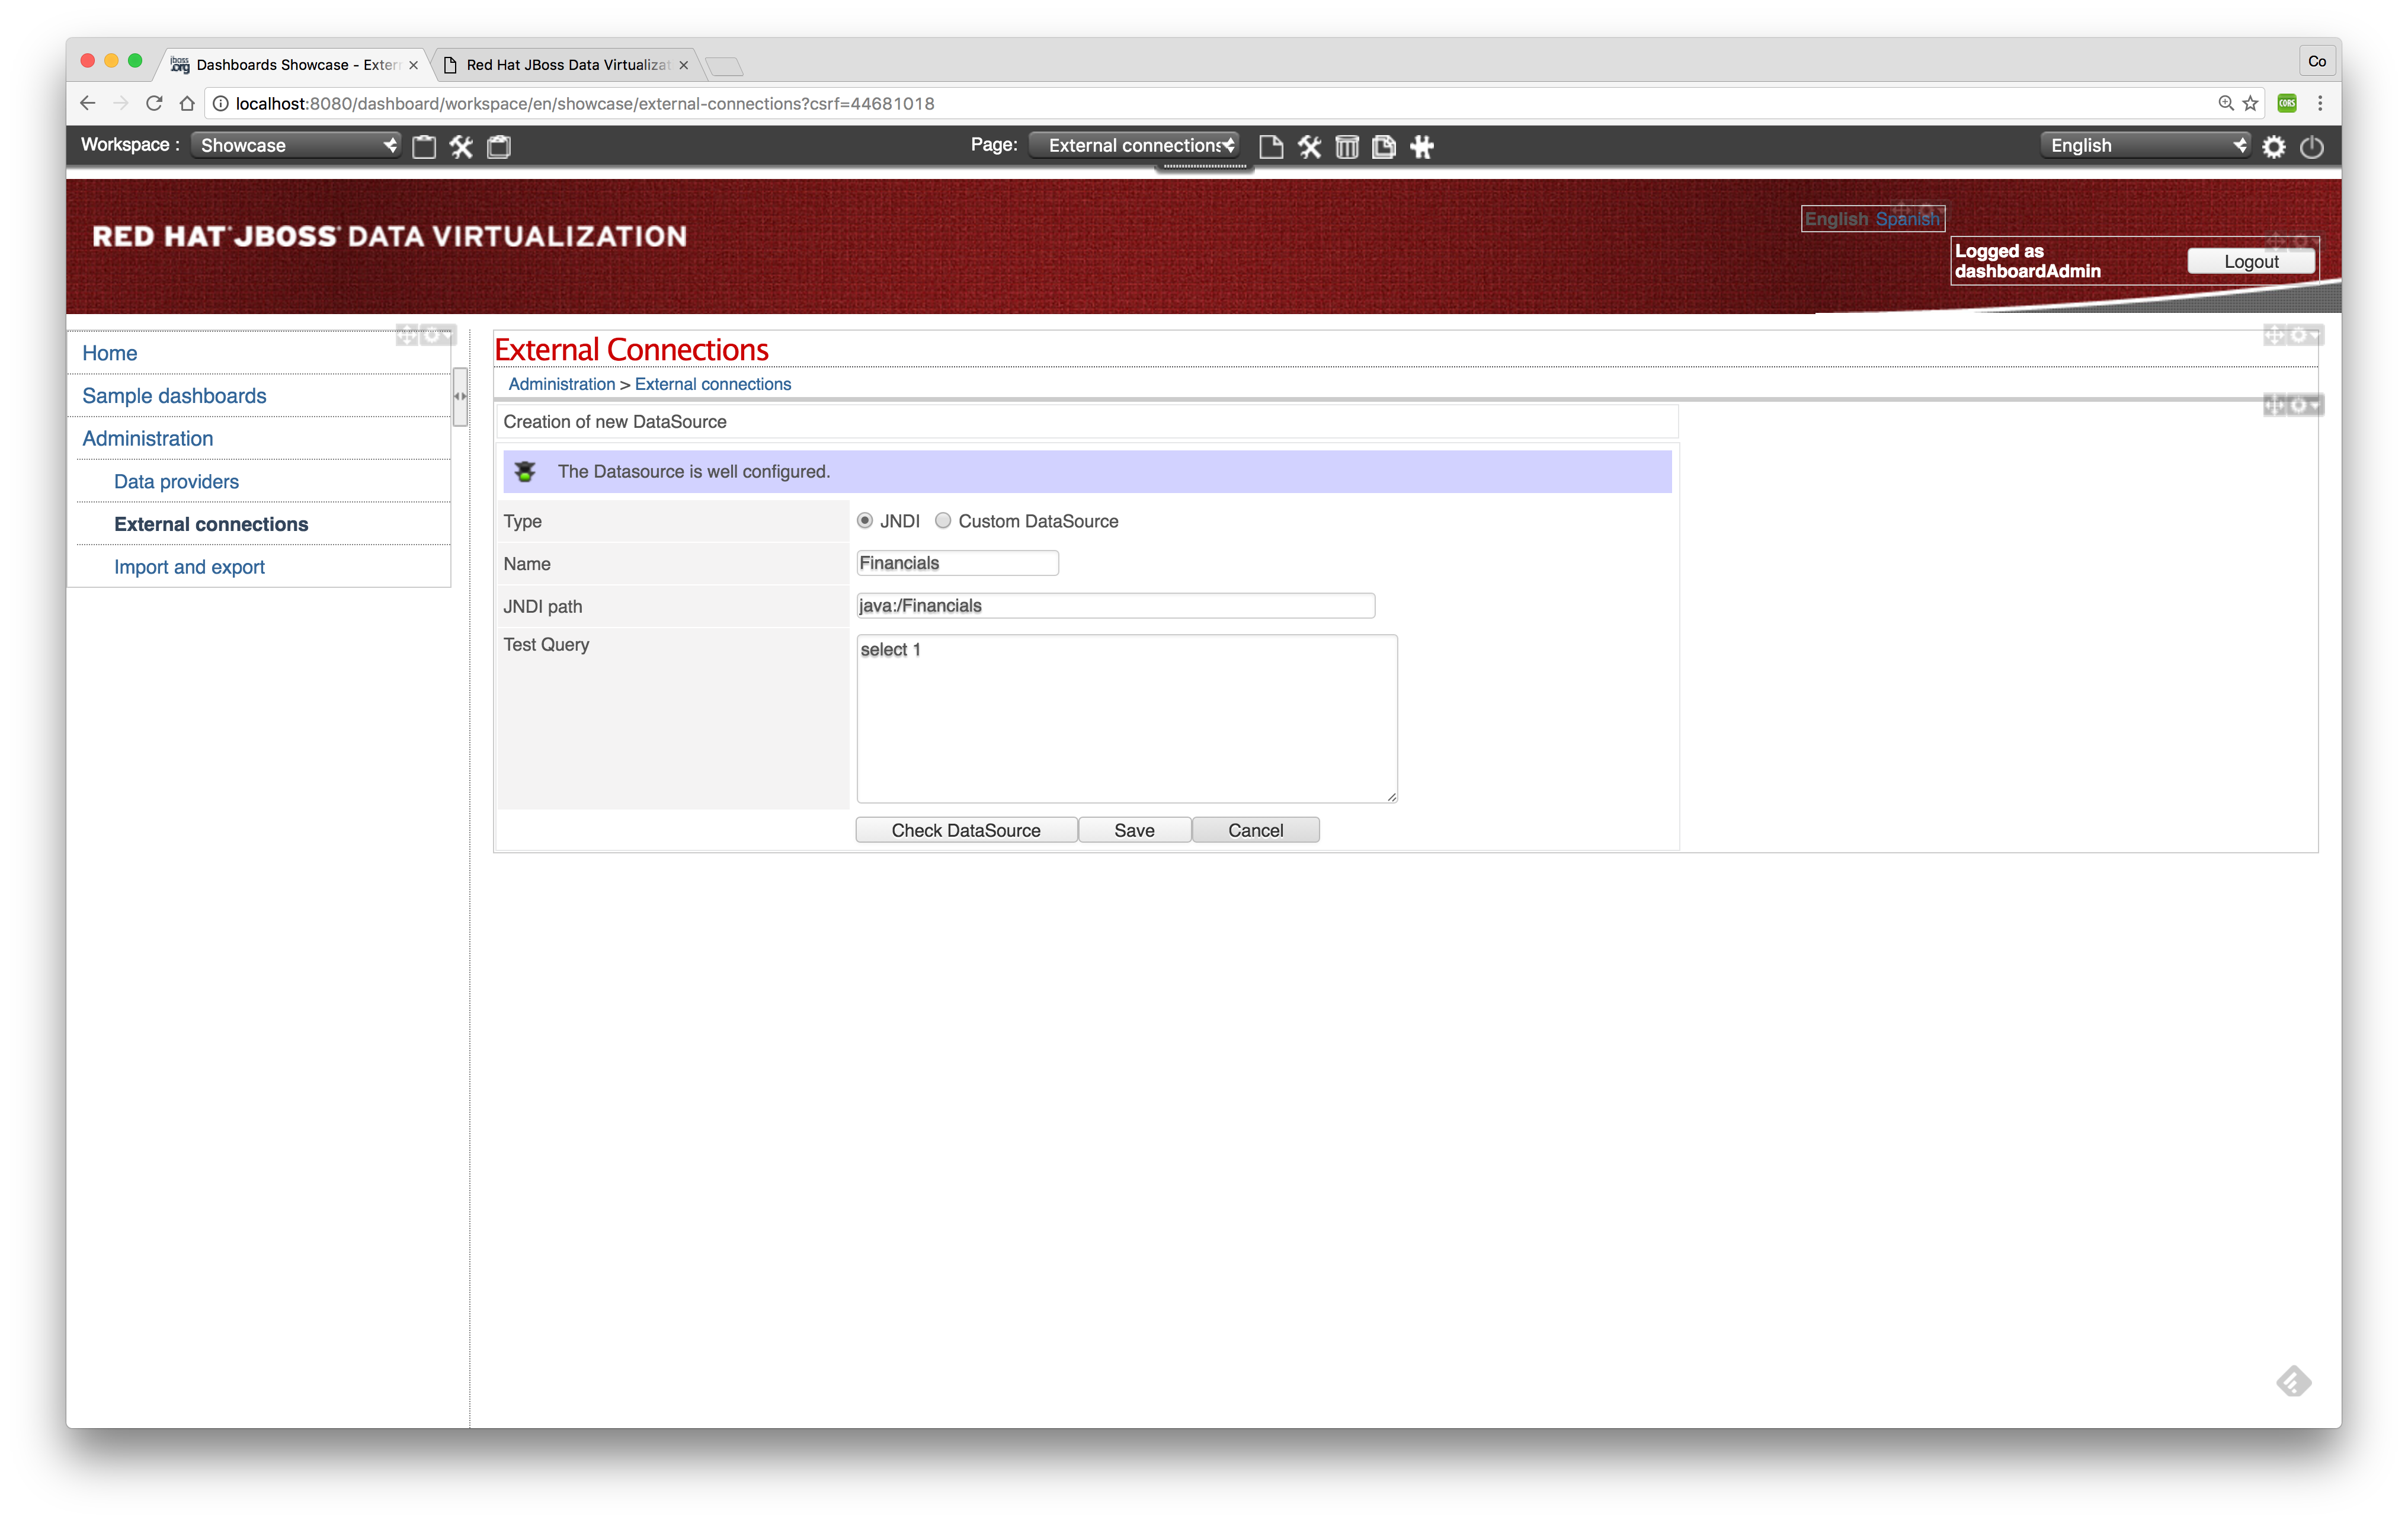
Select JNDI as the type of the datasource and fill in the details of the Financials VDB as shown in the figure above. To verify the connection details of the datasource click btn:[Check DataSource]. This will try to connect using the provided connection details. If the connection is successfully made the following screen should appear:
|
Tip
|
Make sure that the JNDI entry java:/Financials is configured in the JBoss EAP environment and make sure that the Financials VDB is deployed in order to connect successfully. |
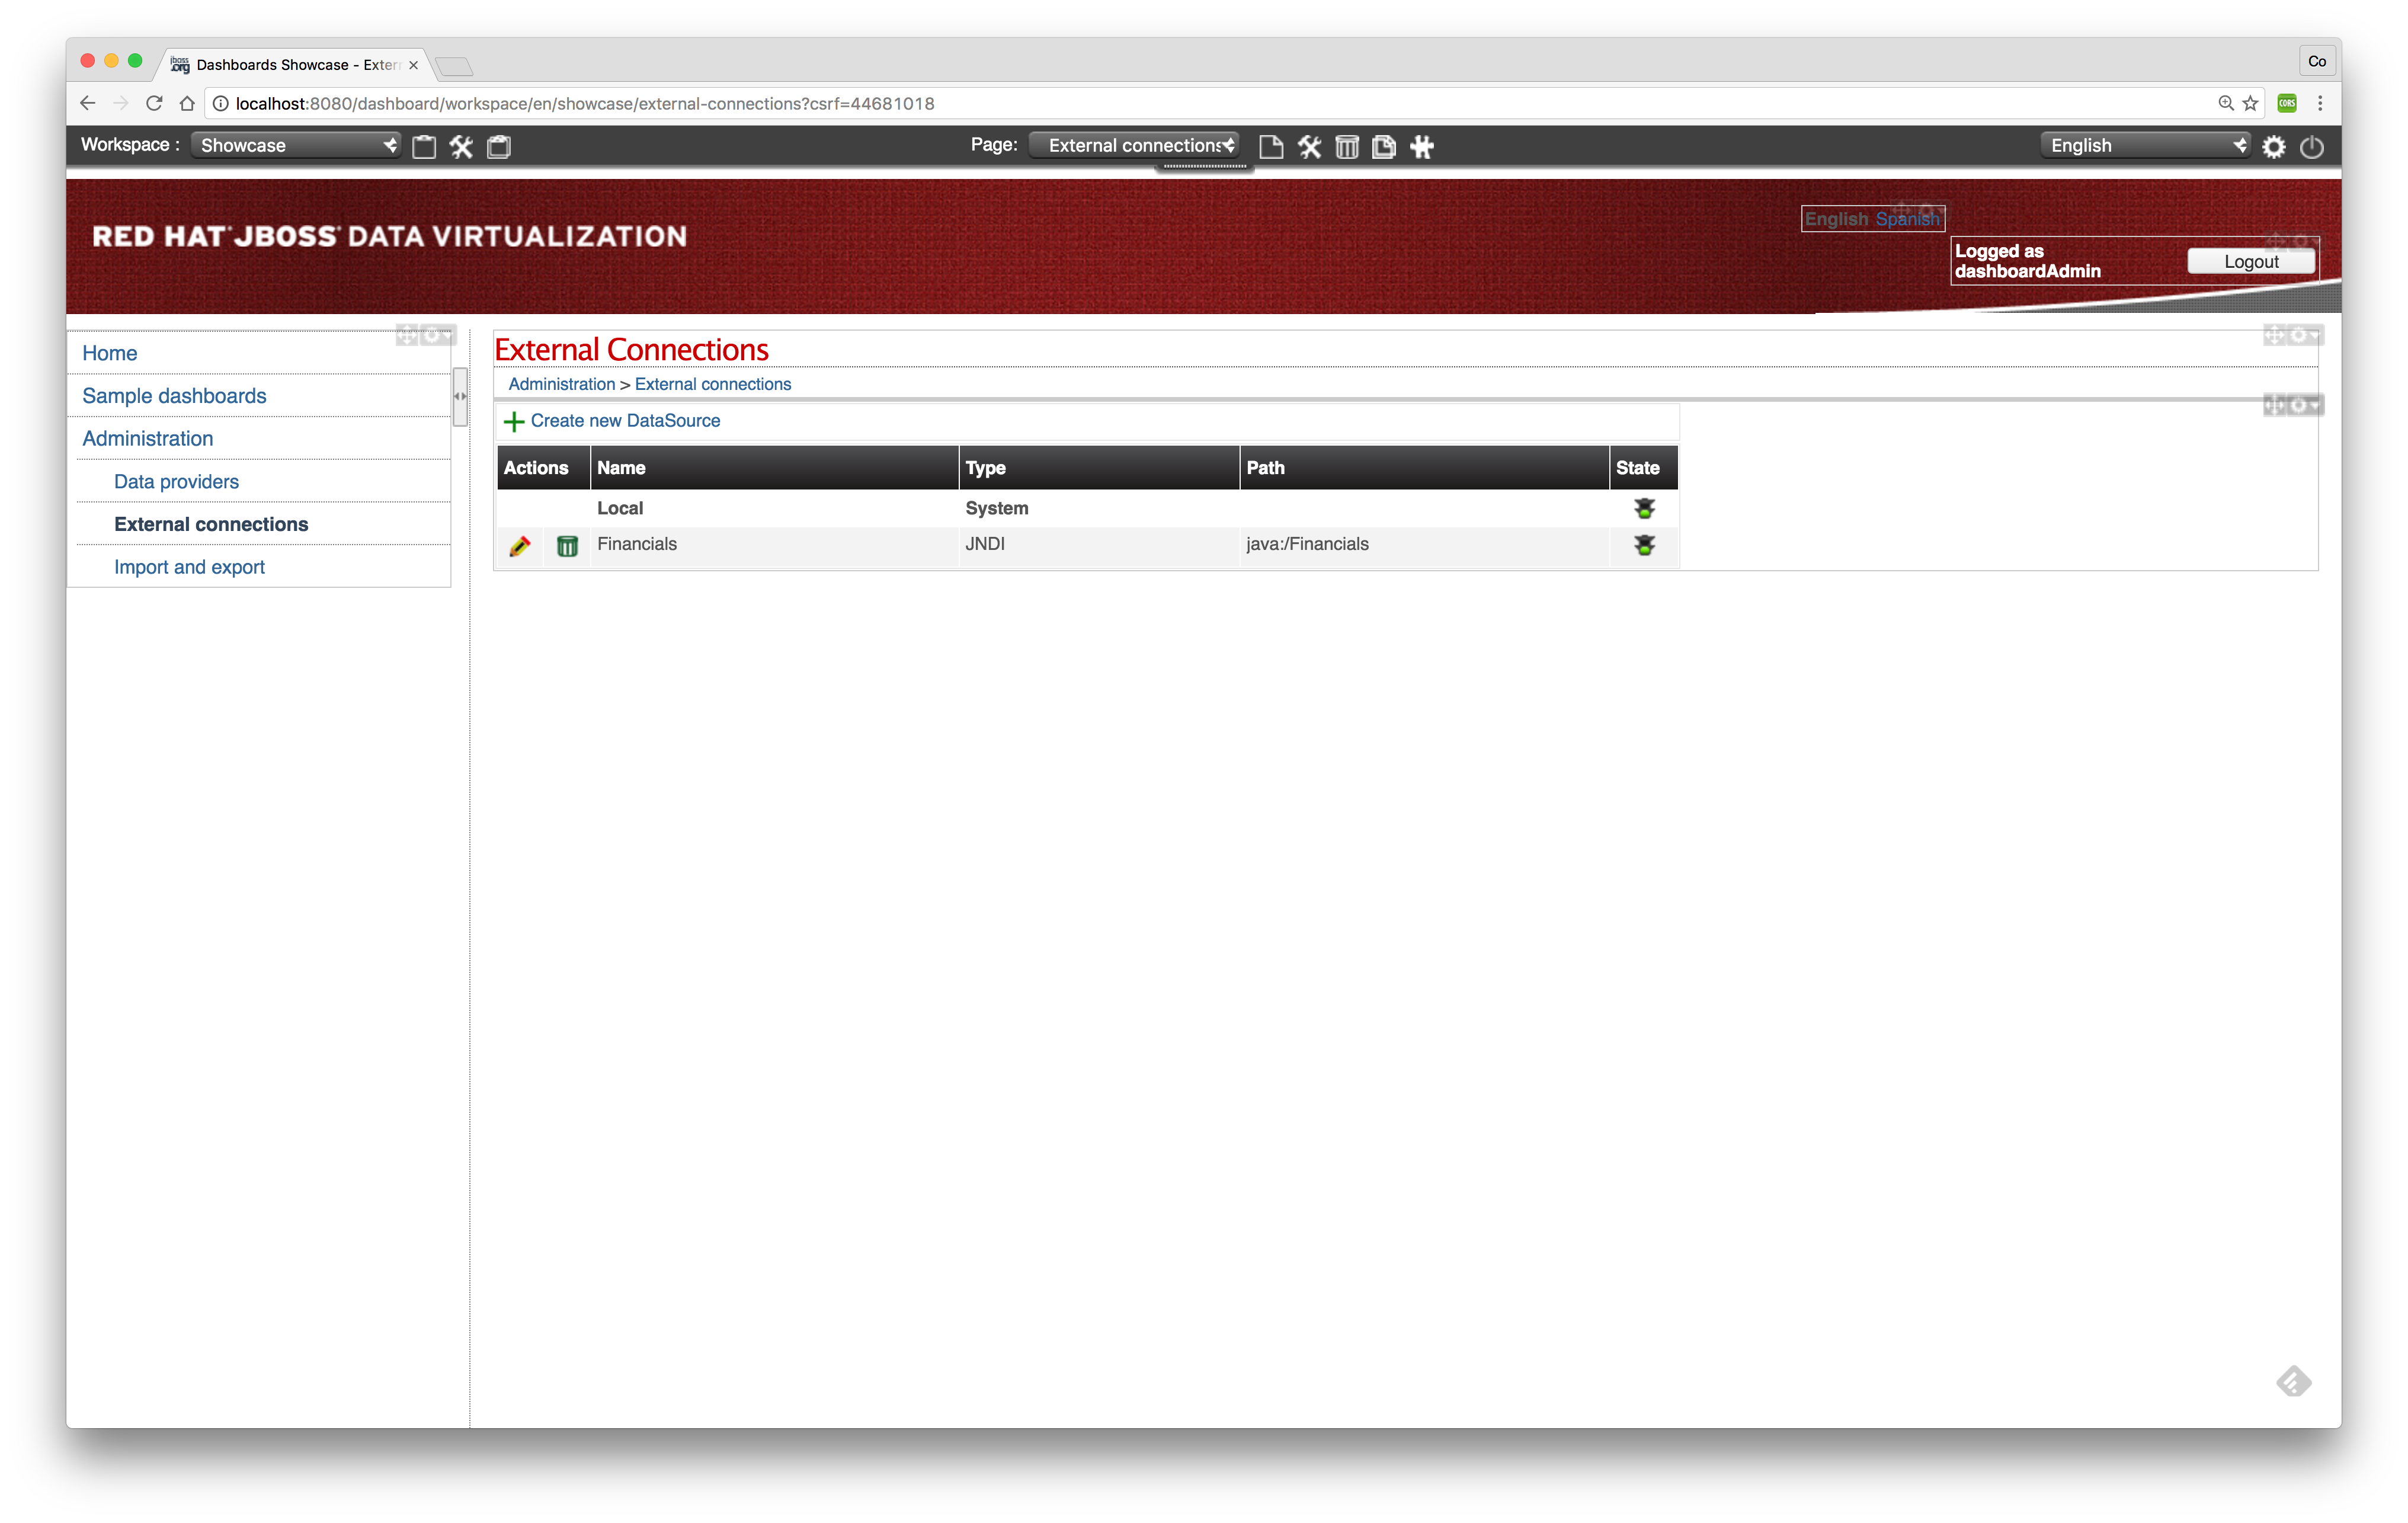
Click btn:[Save] to save the external connection.
-
Create a data provider
Next step is to create a data provider based on the previous created external connection. Select menu:Administration[Data providers] and the following screen should appear.
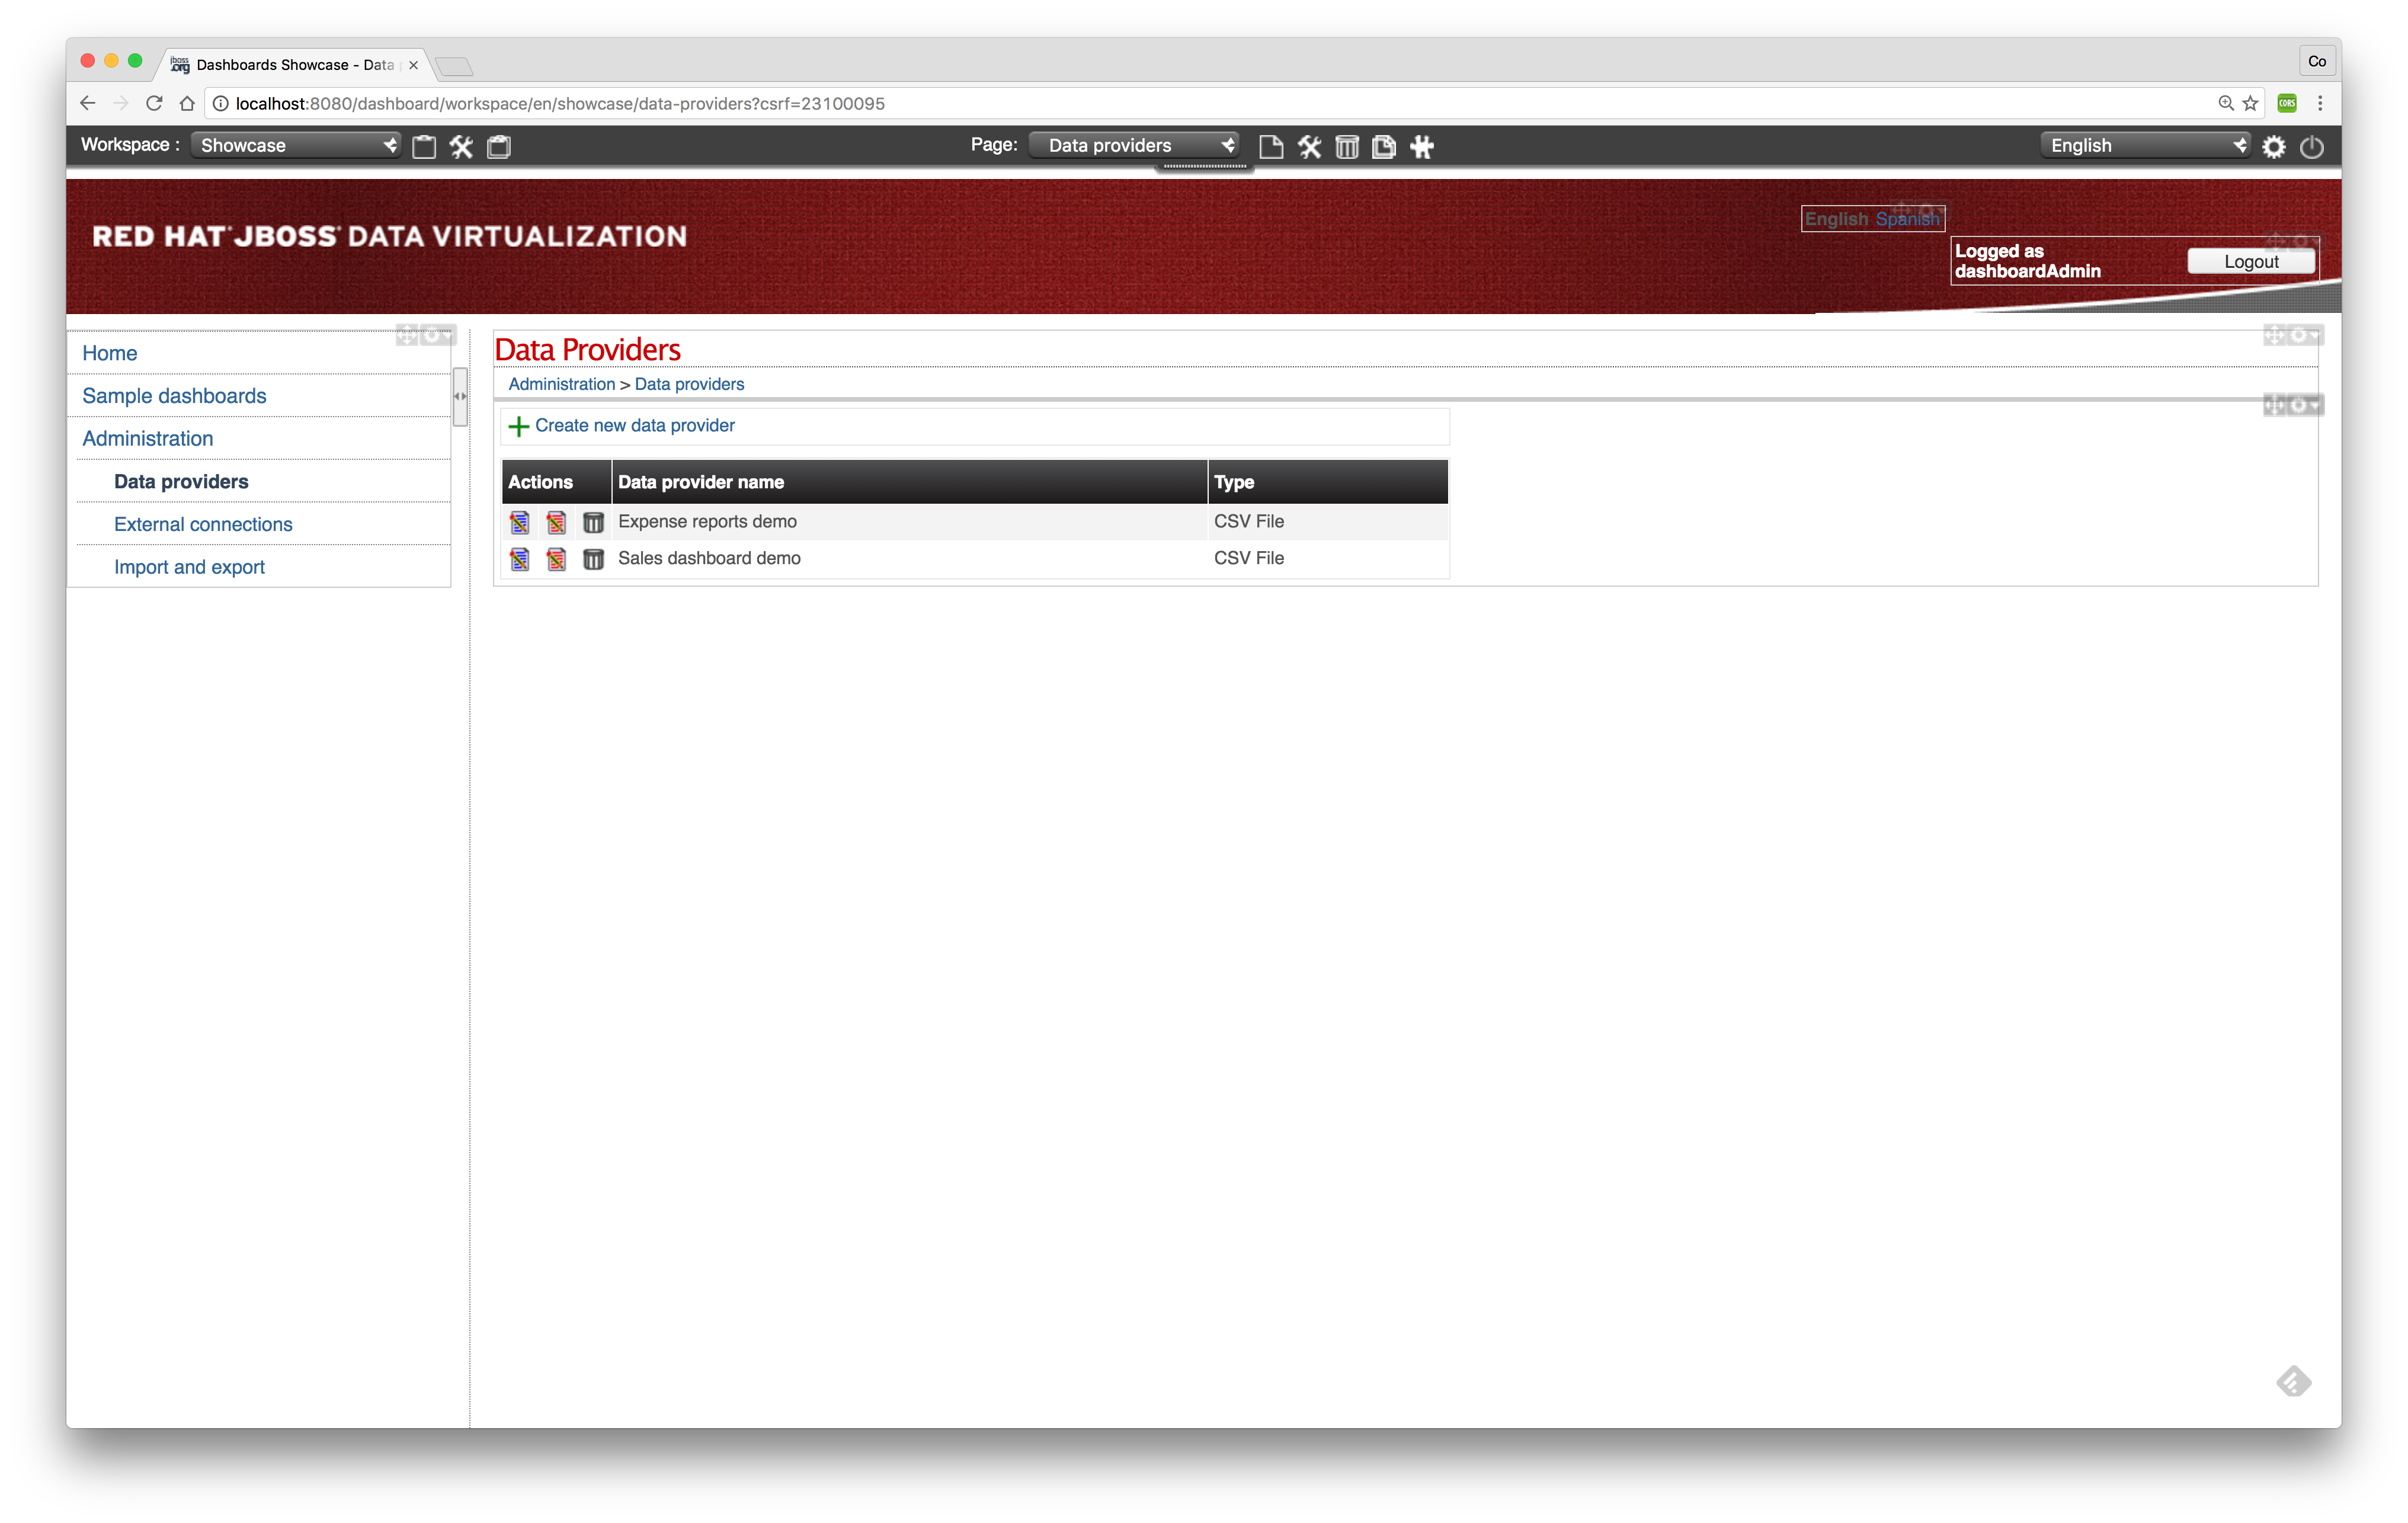
To create a new data provider select btn:[+ Create new data provider]. The following screen should appear:
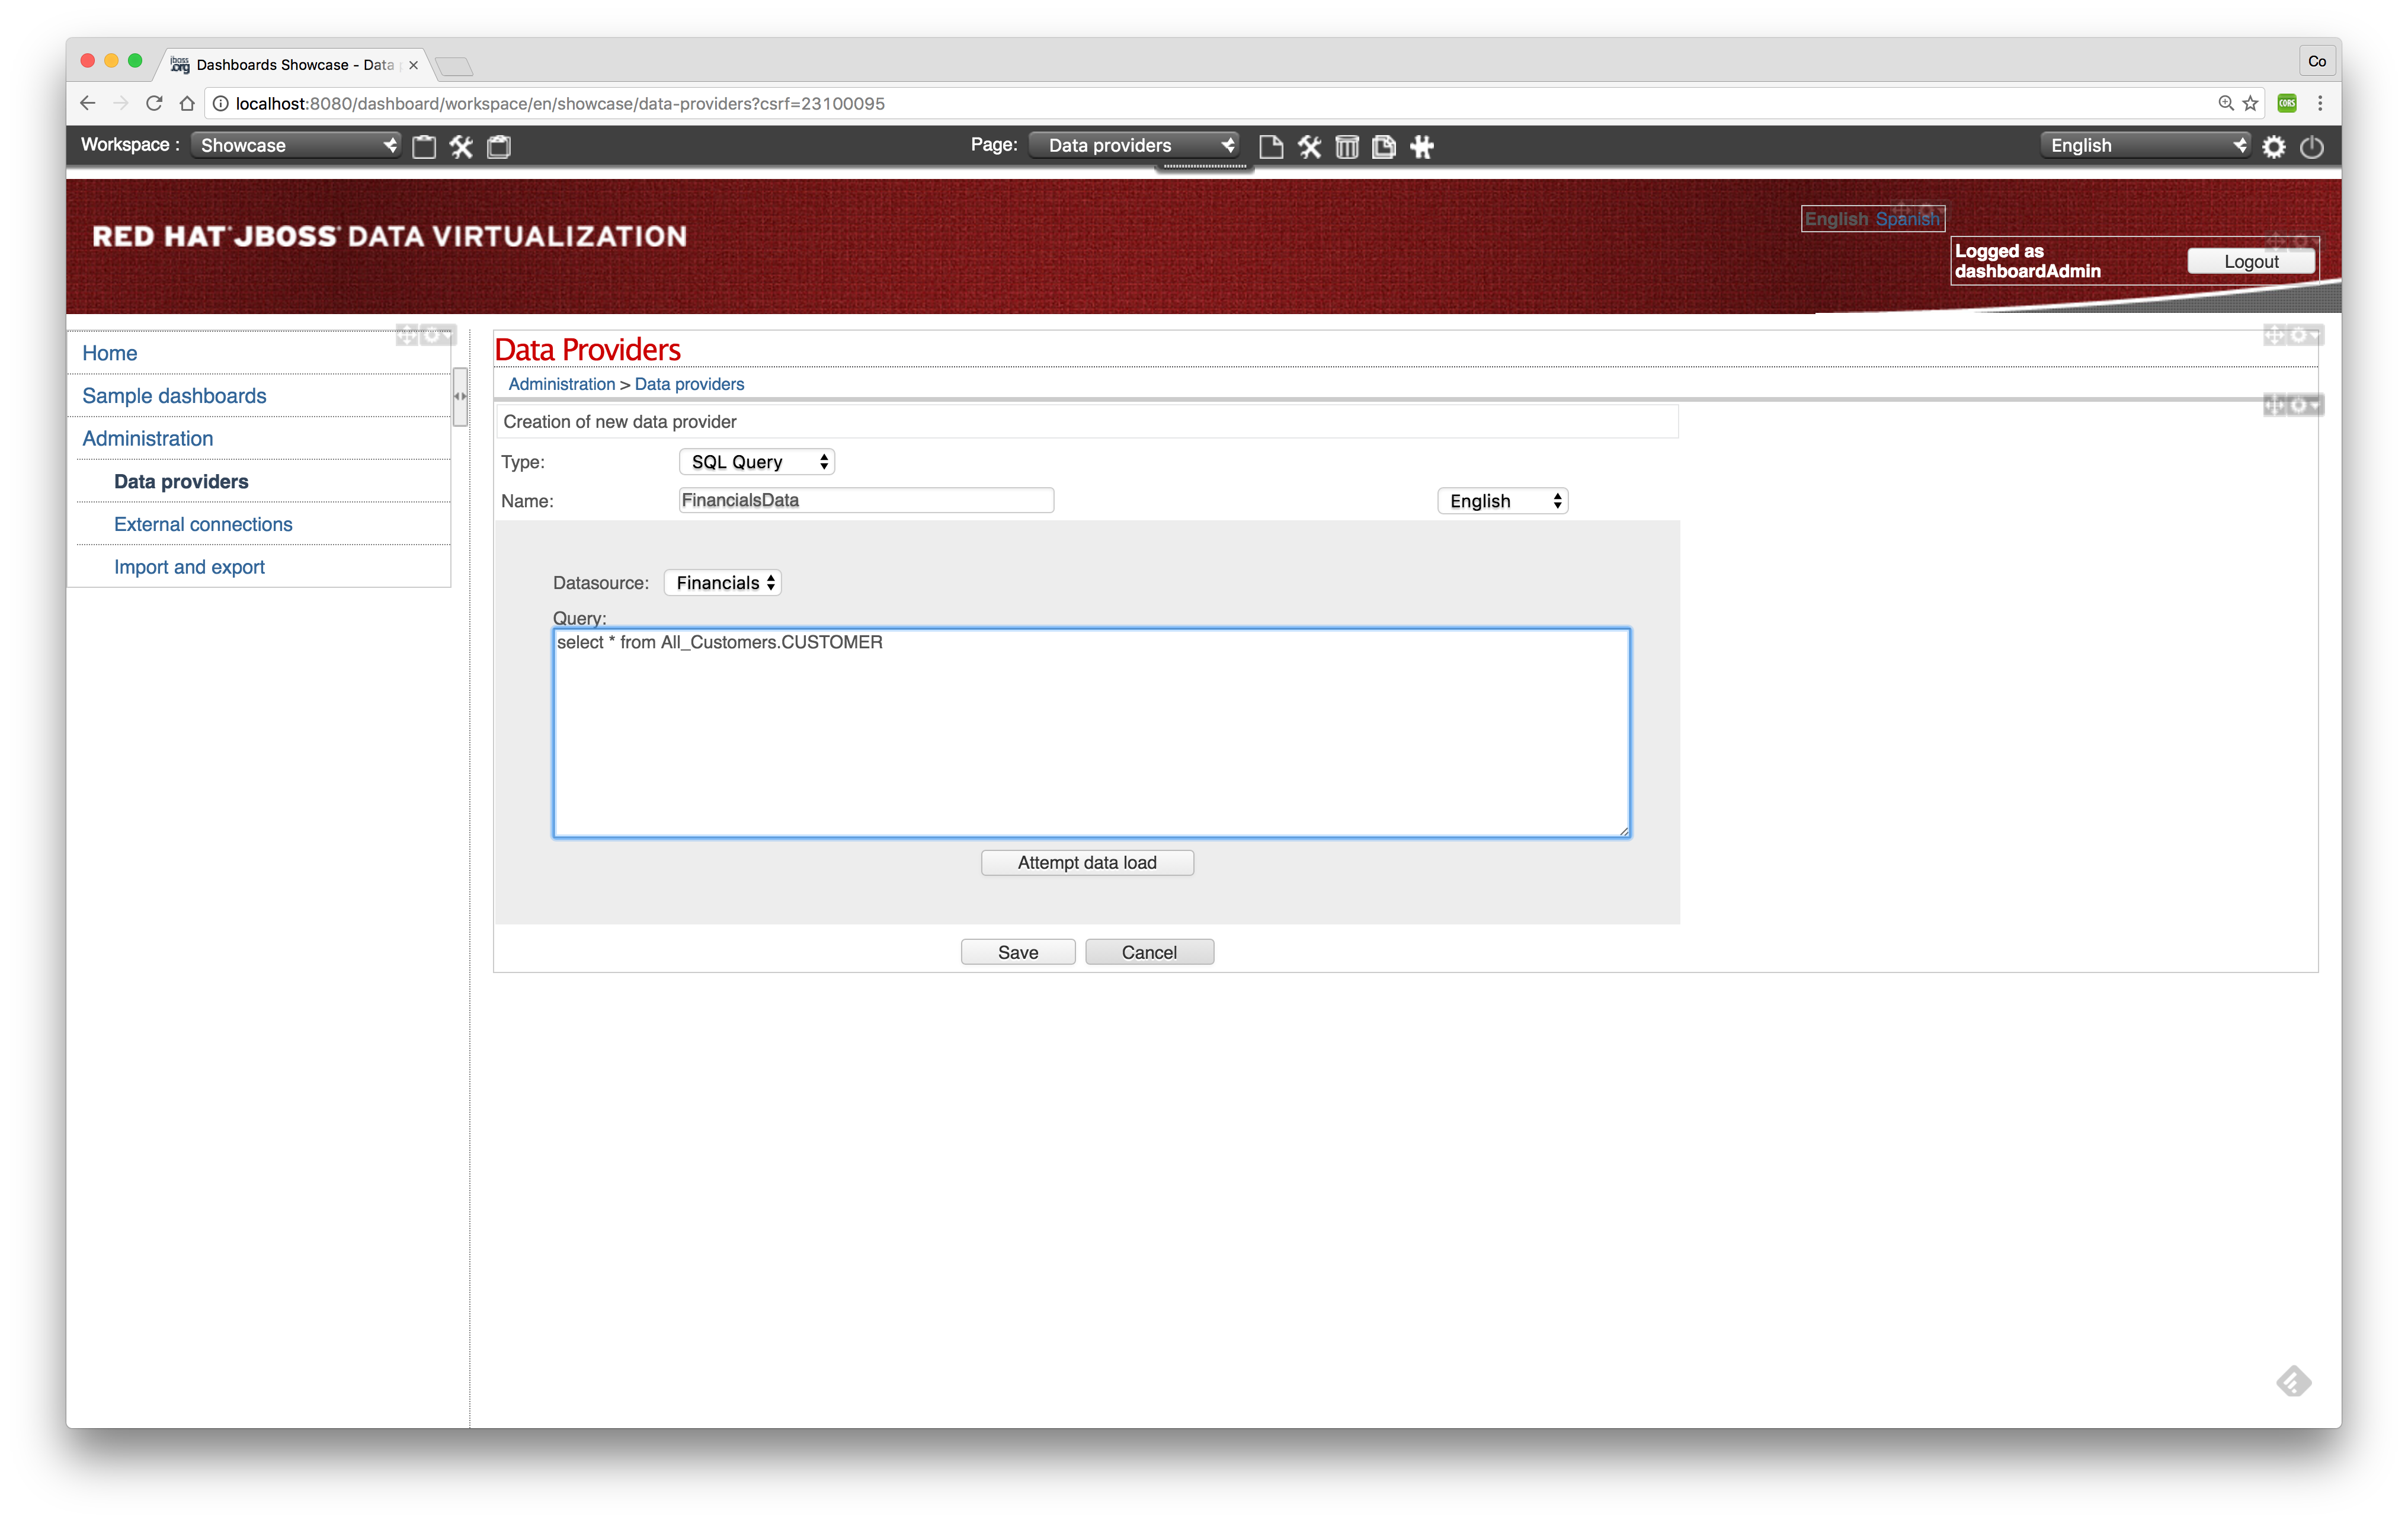
Enter a name for the data provider and select Financials as the Datasource. Furthermore you have to specify the query to get the relevant data from the Financials VDB. After you have specified the query click btn:[Attempt data load] to validate the query. If the query is executed successfully the following screen should appear.

Click btn:[Save] to save the data provider definition. The following screen should appear. In this screen one can change the definition of the column names as required by the dashboard.
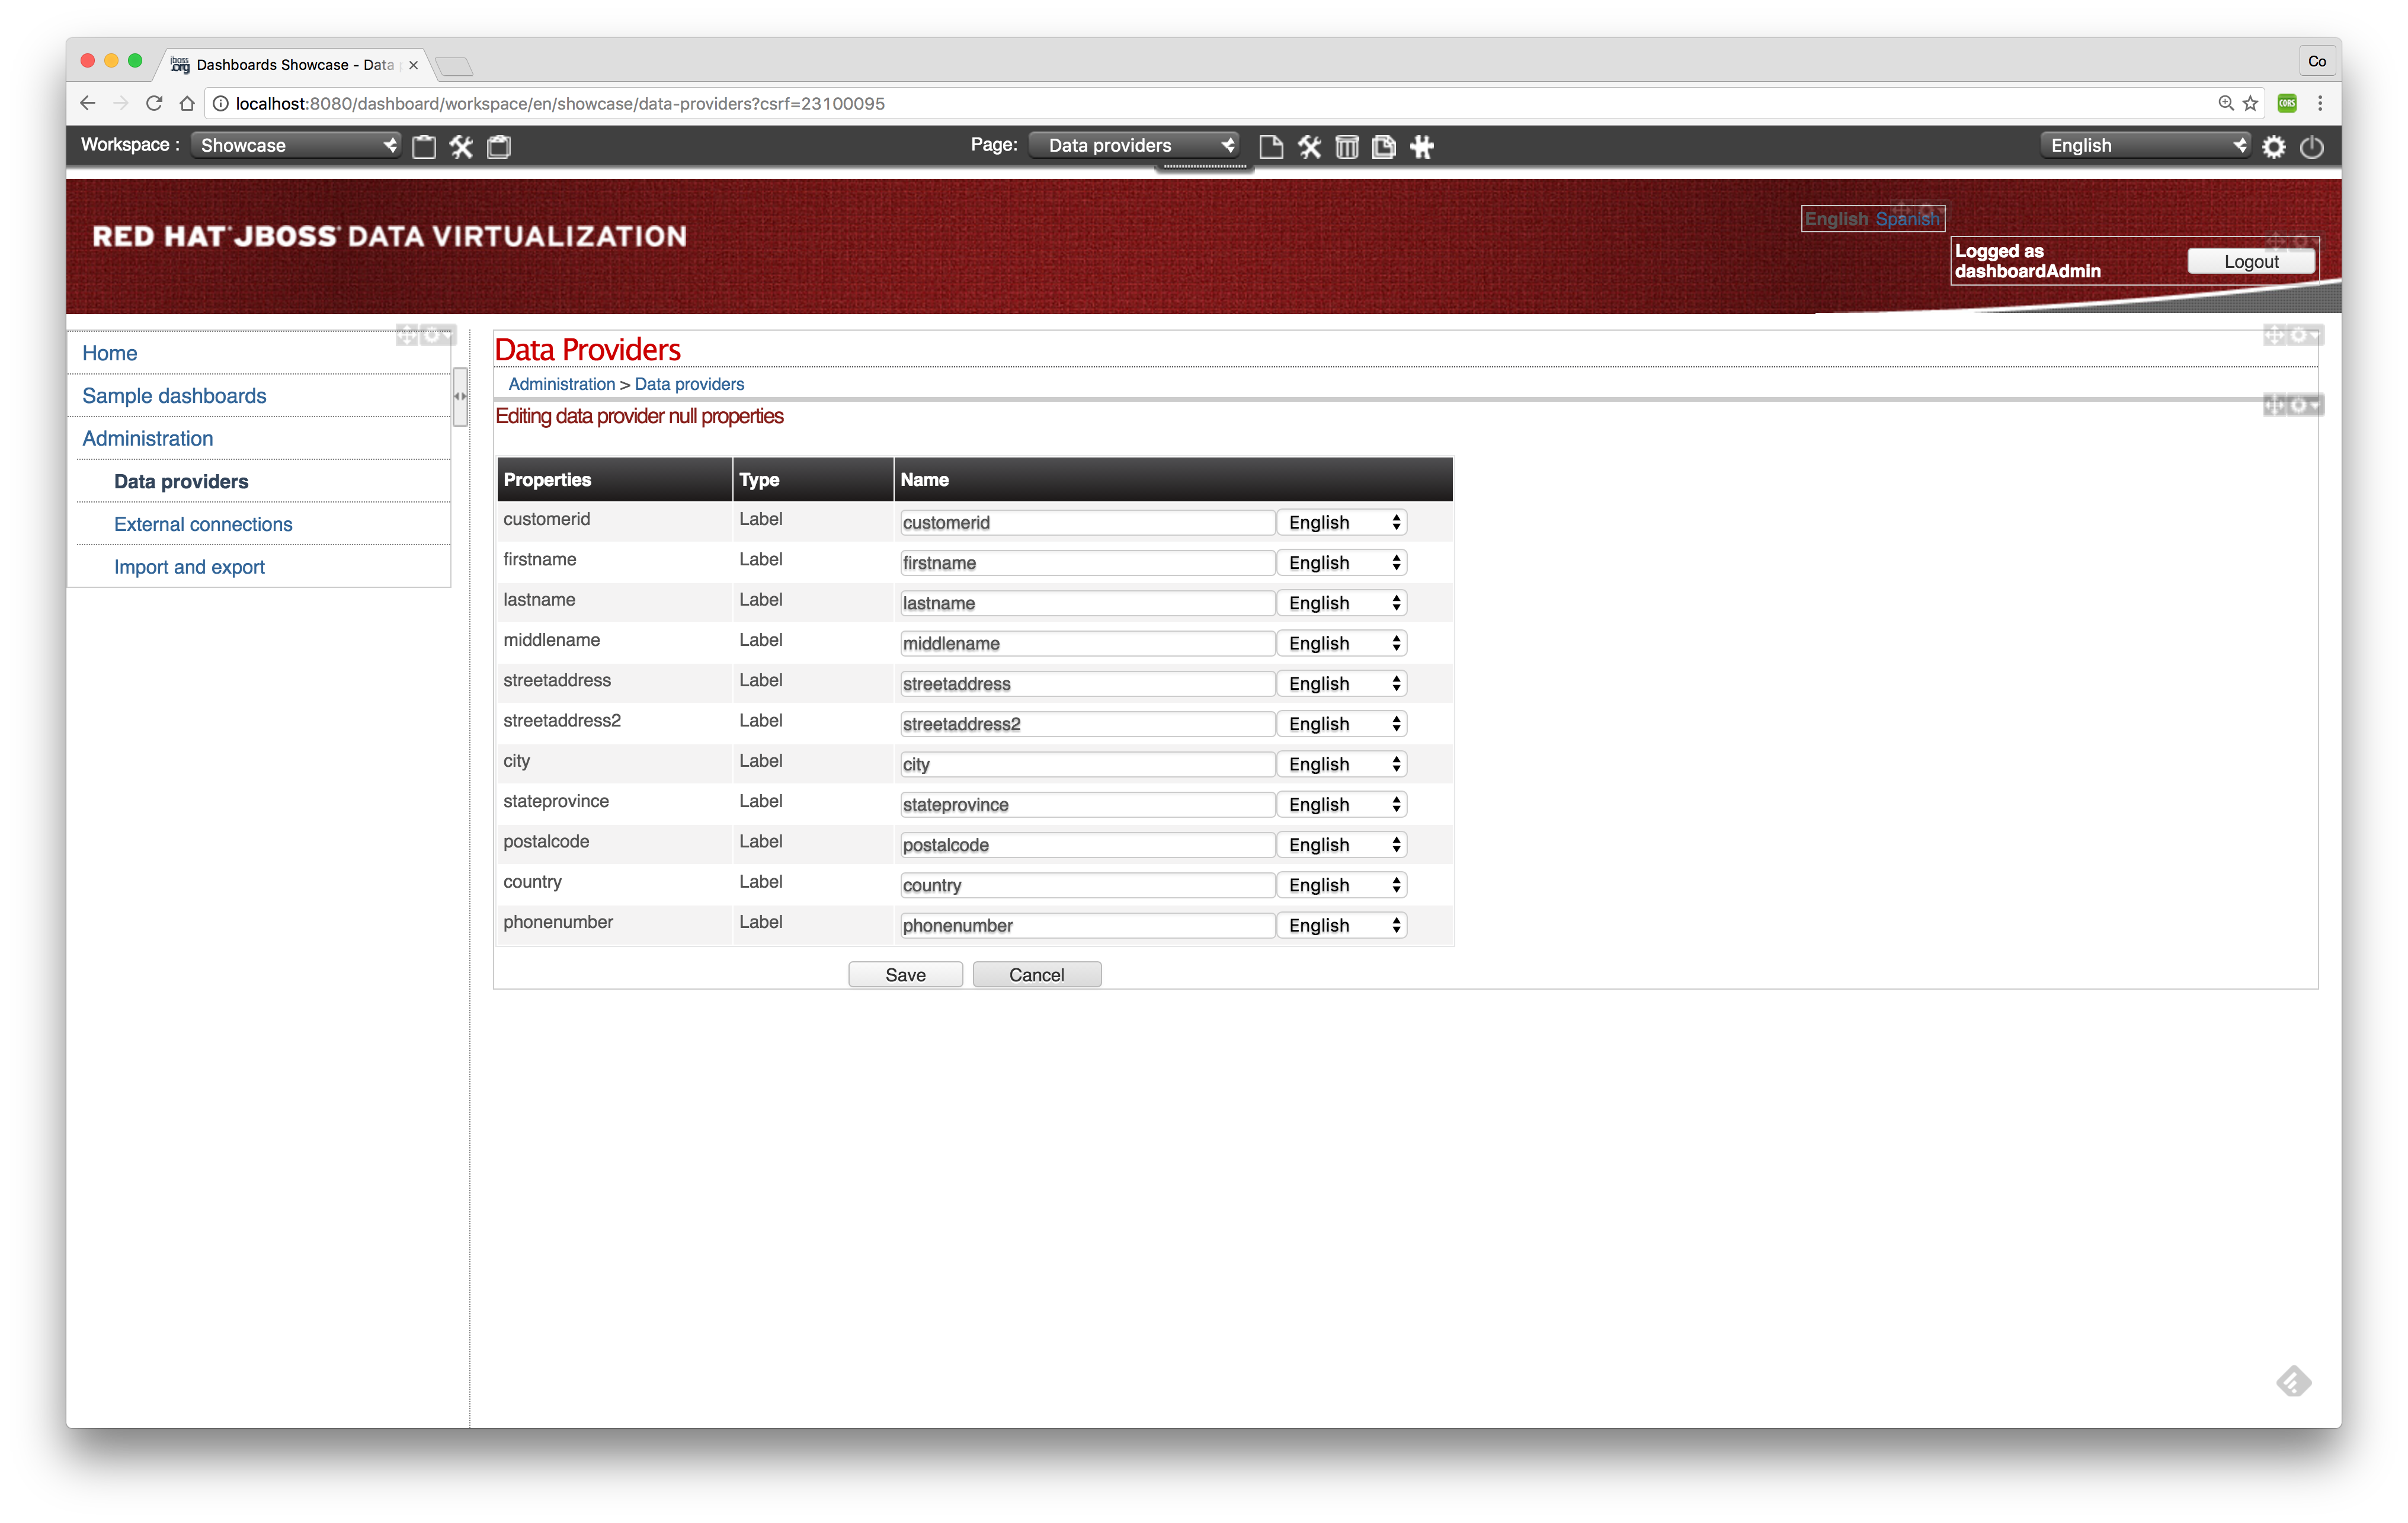
Update the column names as necessary and click btn:[Save].
-
Create a workspace
The top bar contains several button options to create the dashboard. The picture below explains the buttons in more detail.
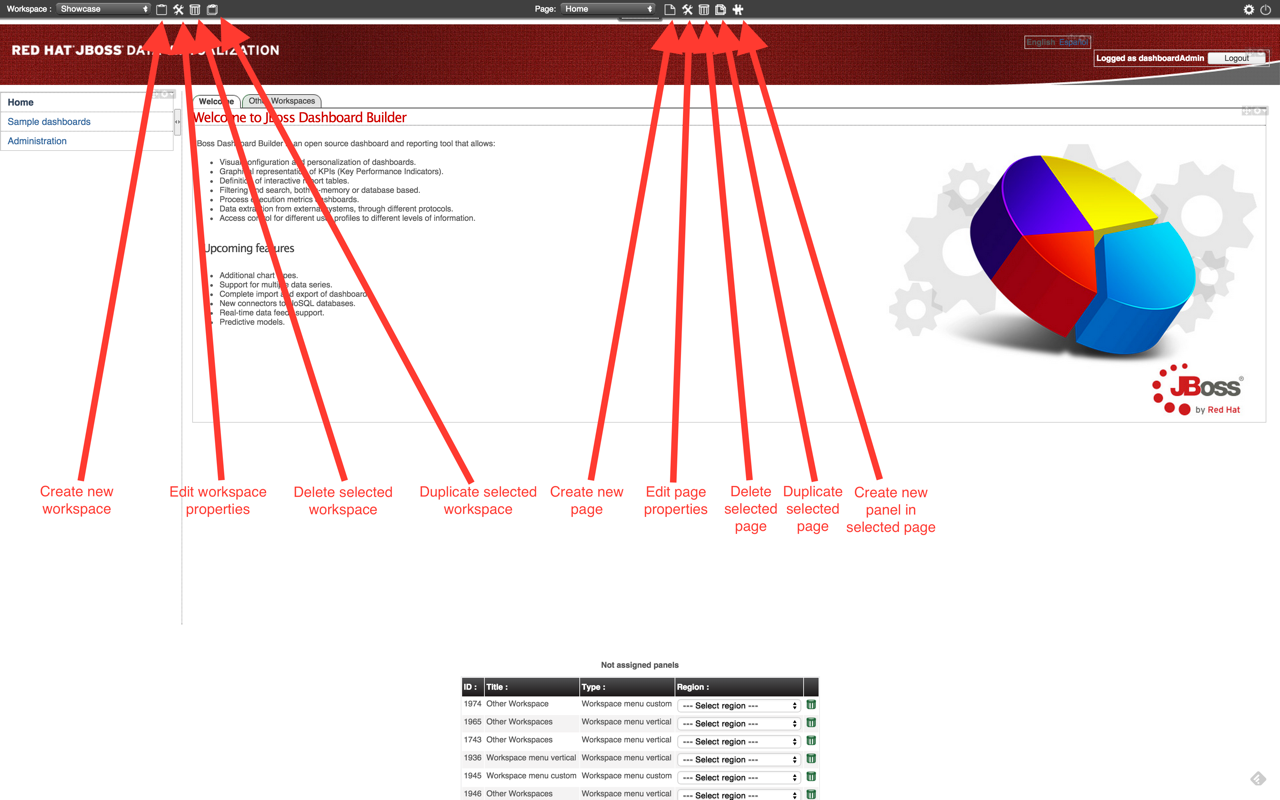
We are ready to create a Financials dashboard based on the Financials data we created in the previous labs.
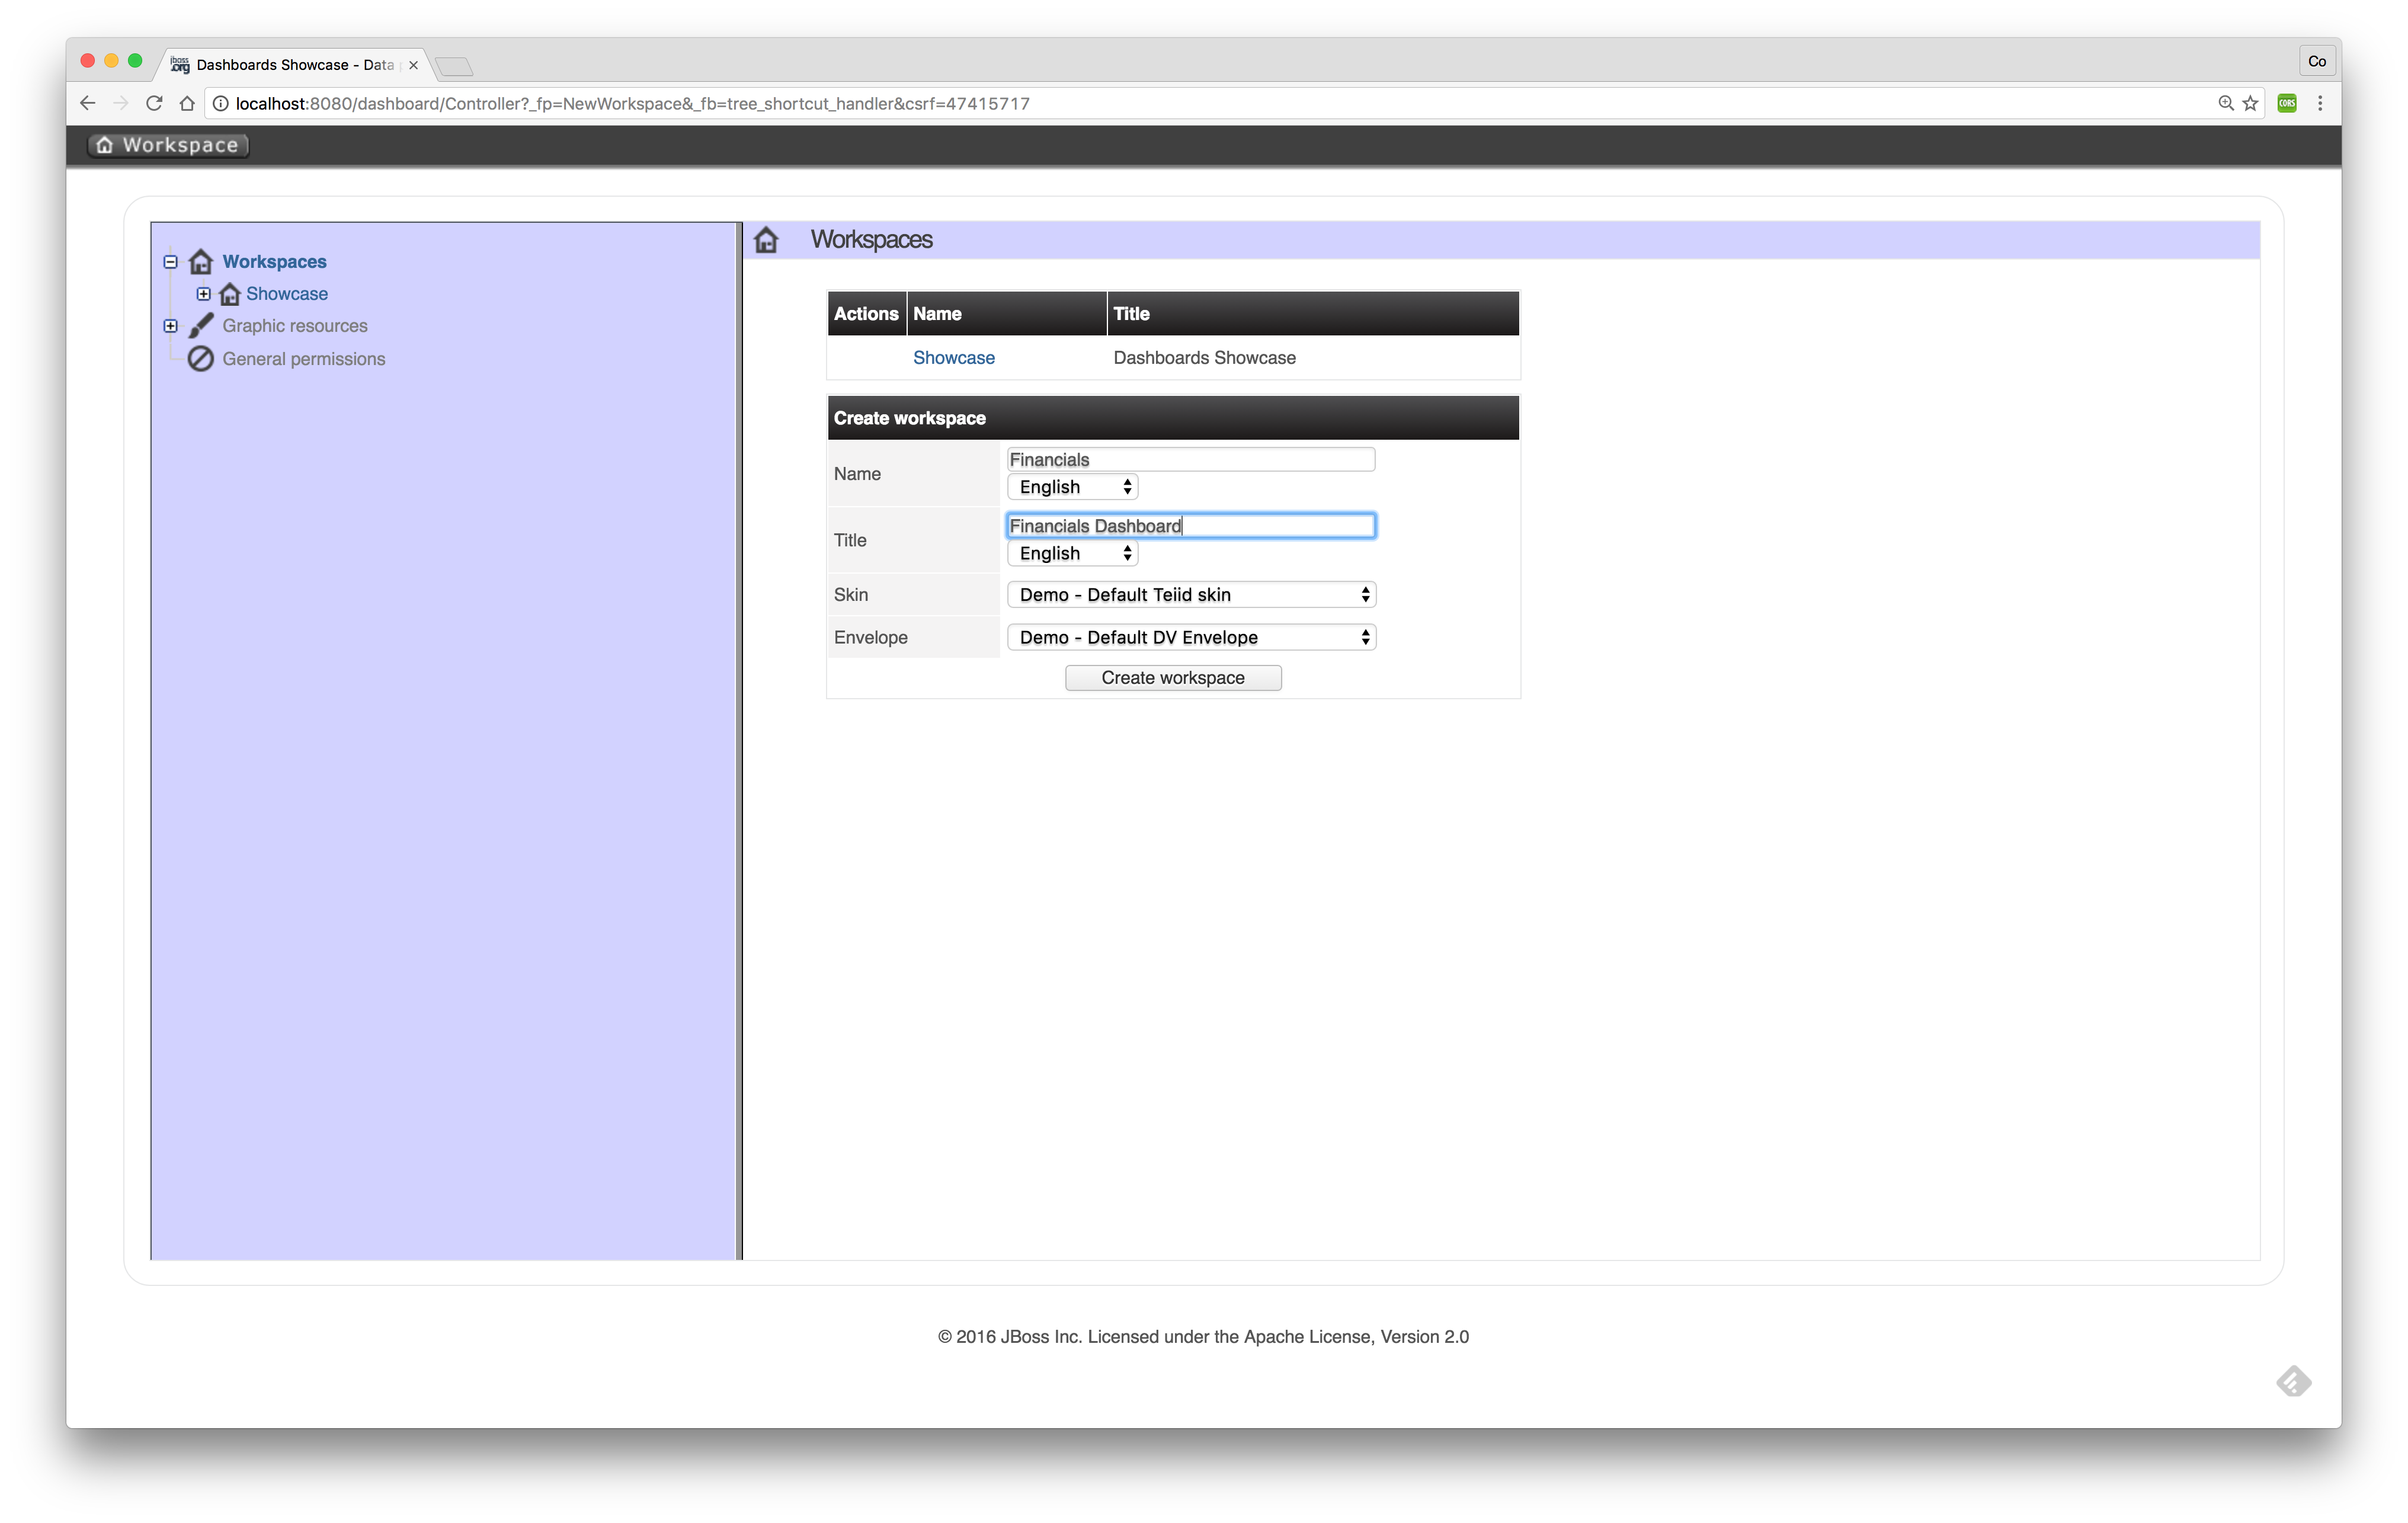
Click btn:[Create workspace] to create the Financials workspace.
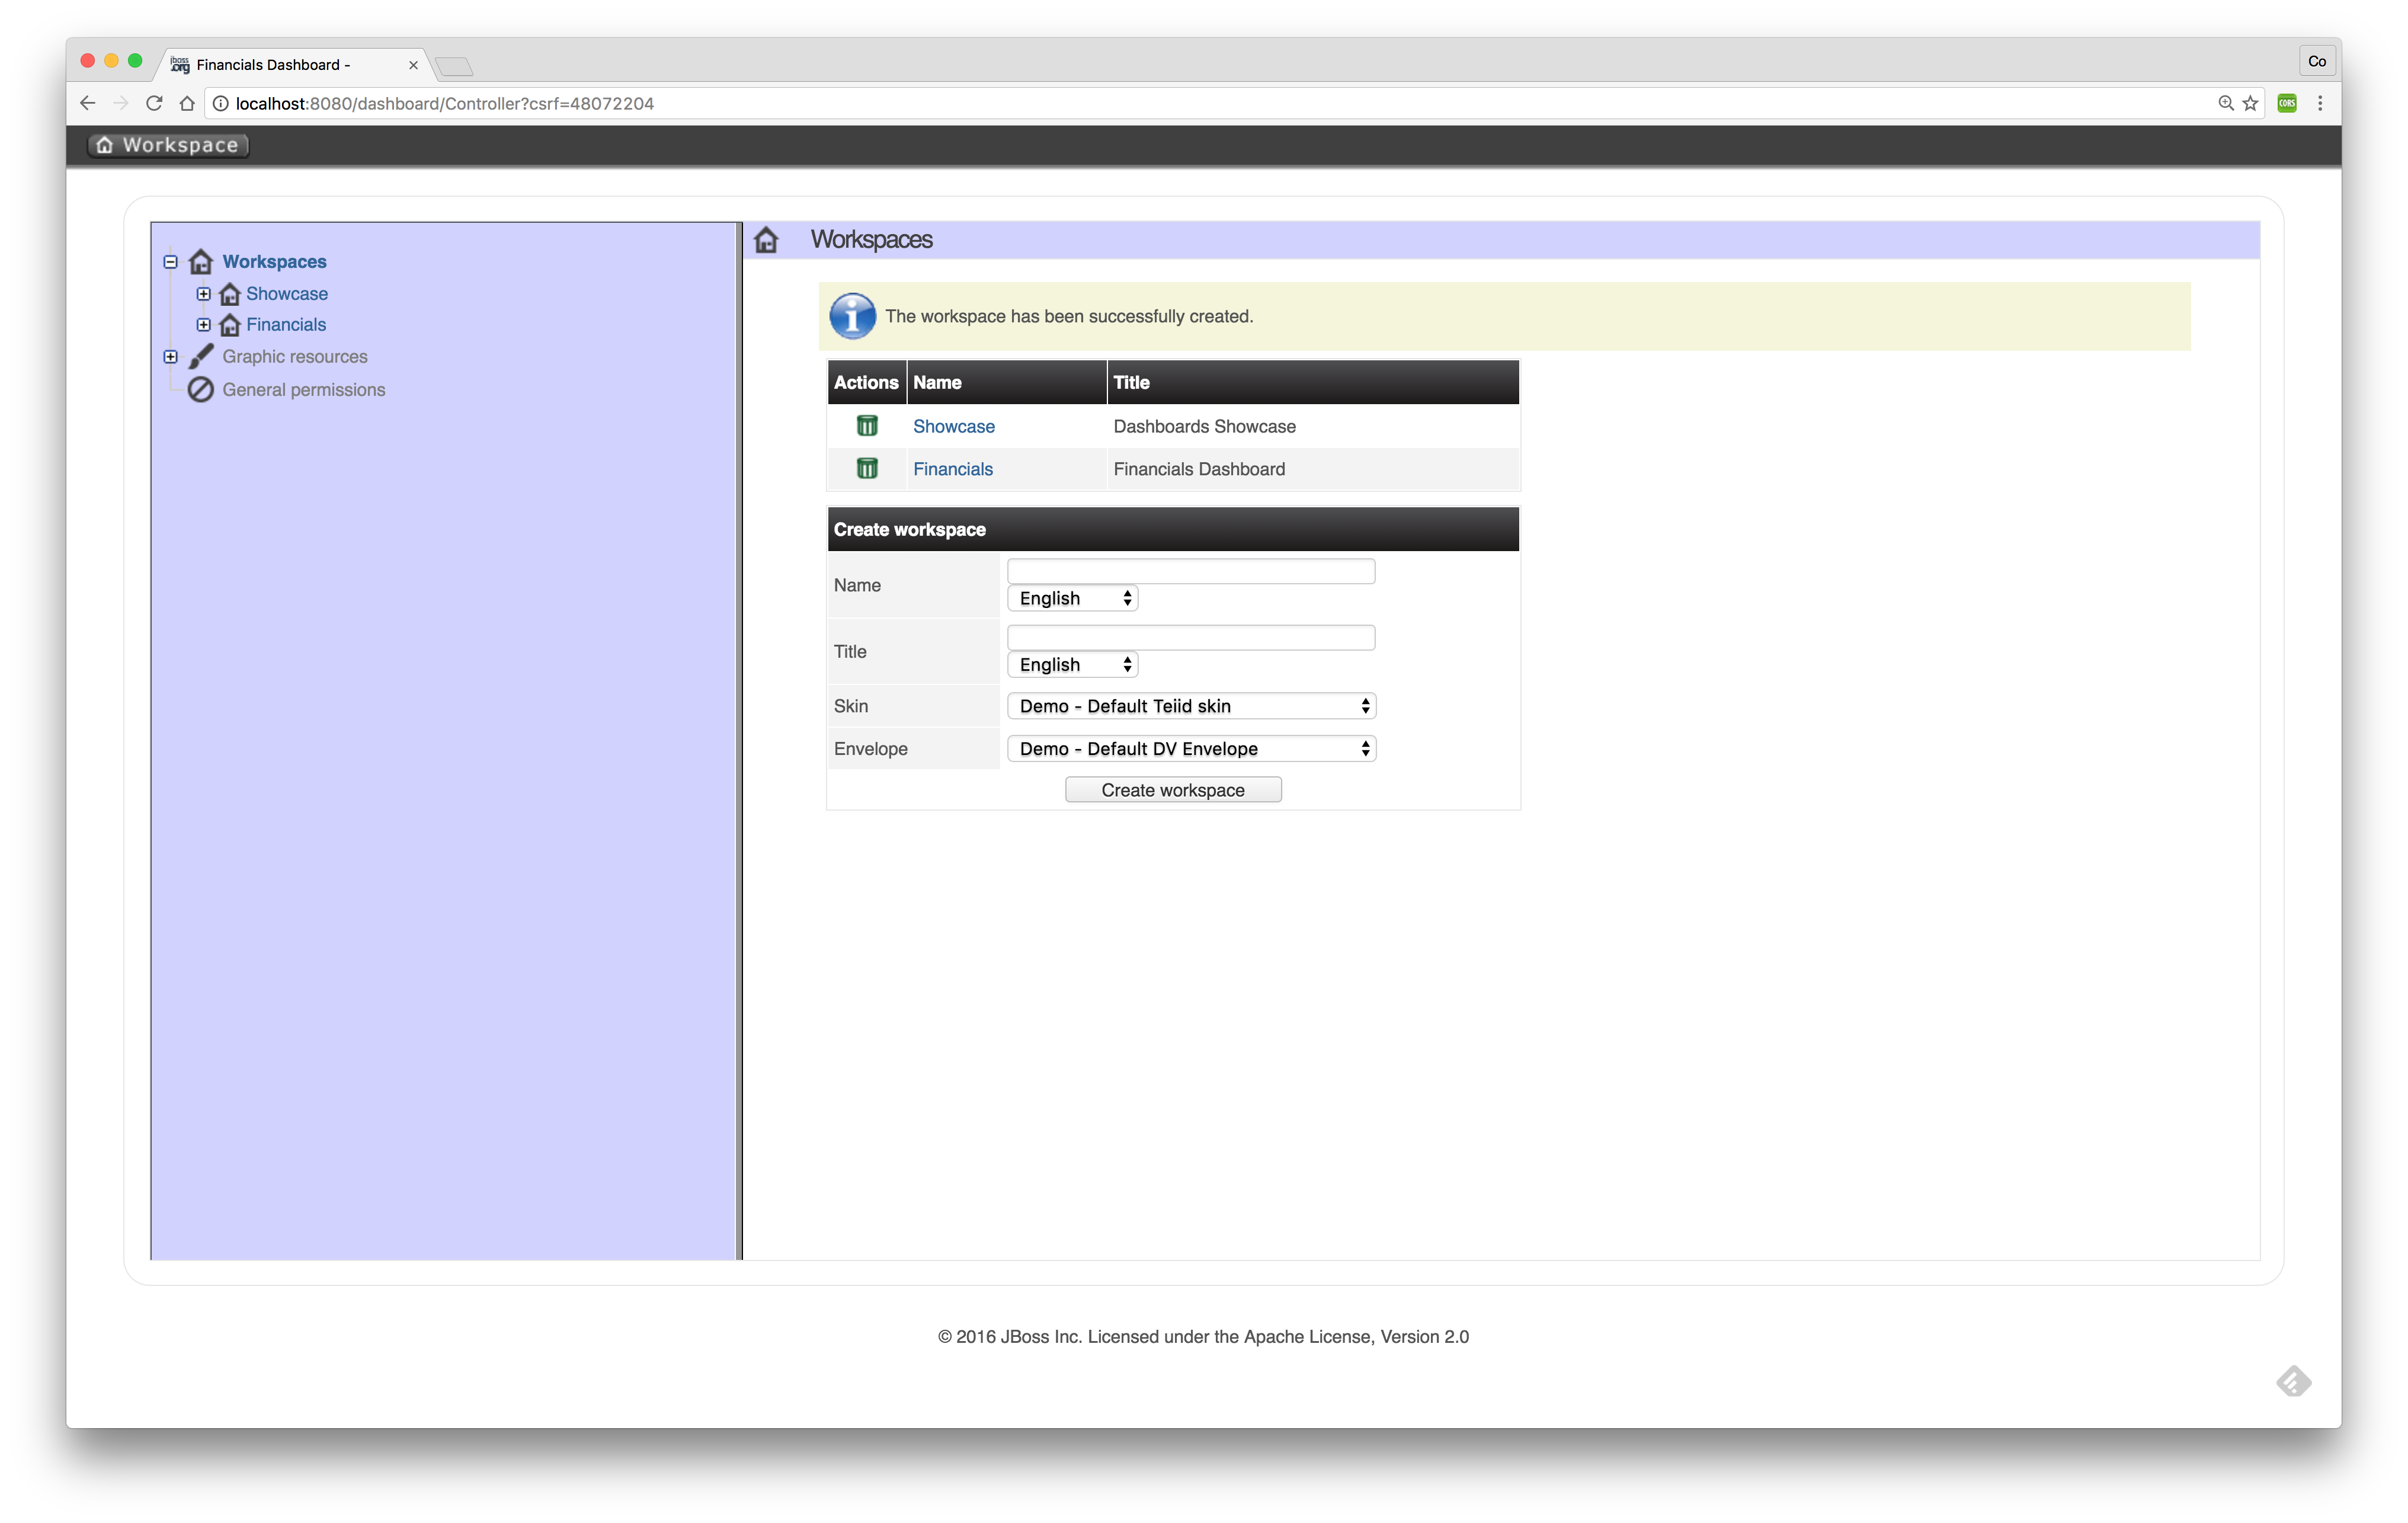
Now we have completed the creation of the workspace we can add pages to it to create a full functioning dashboard.
-
Create a page
Now we are going to create our first page in the Financials workspace.
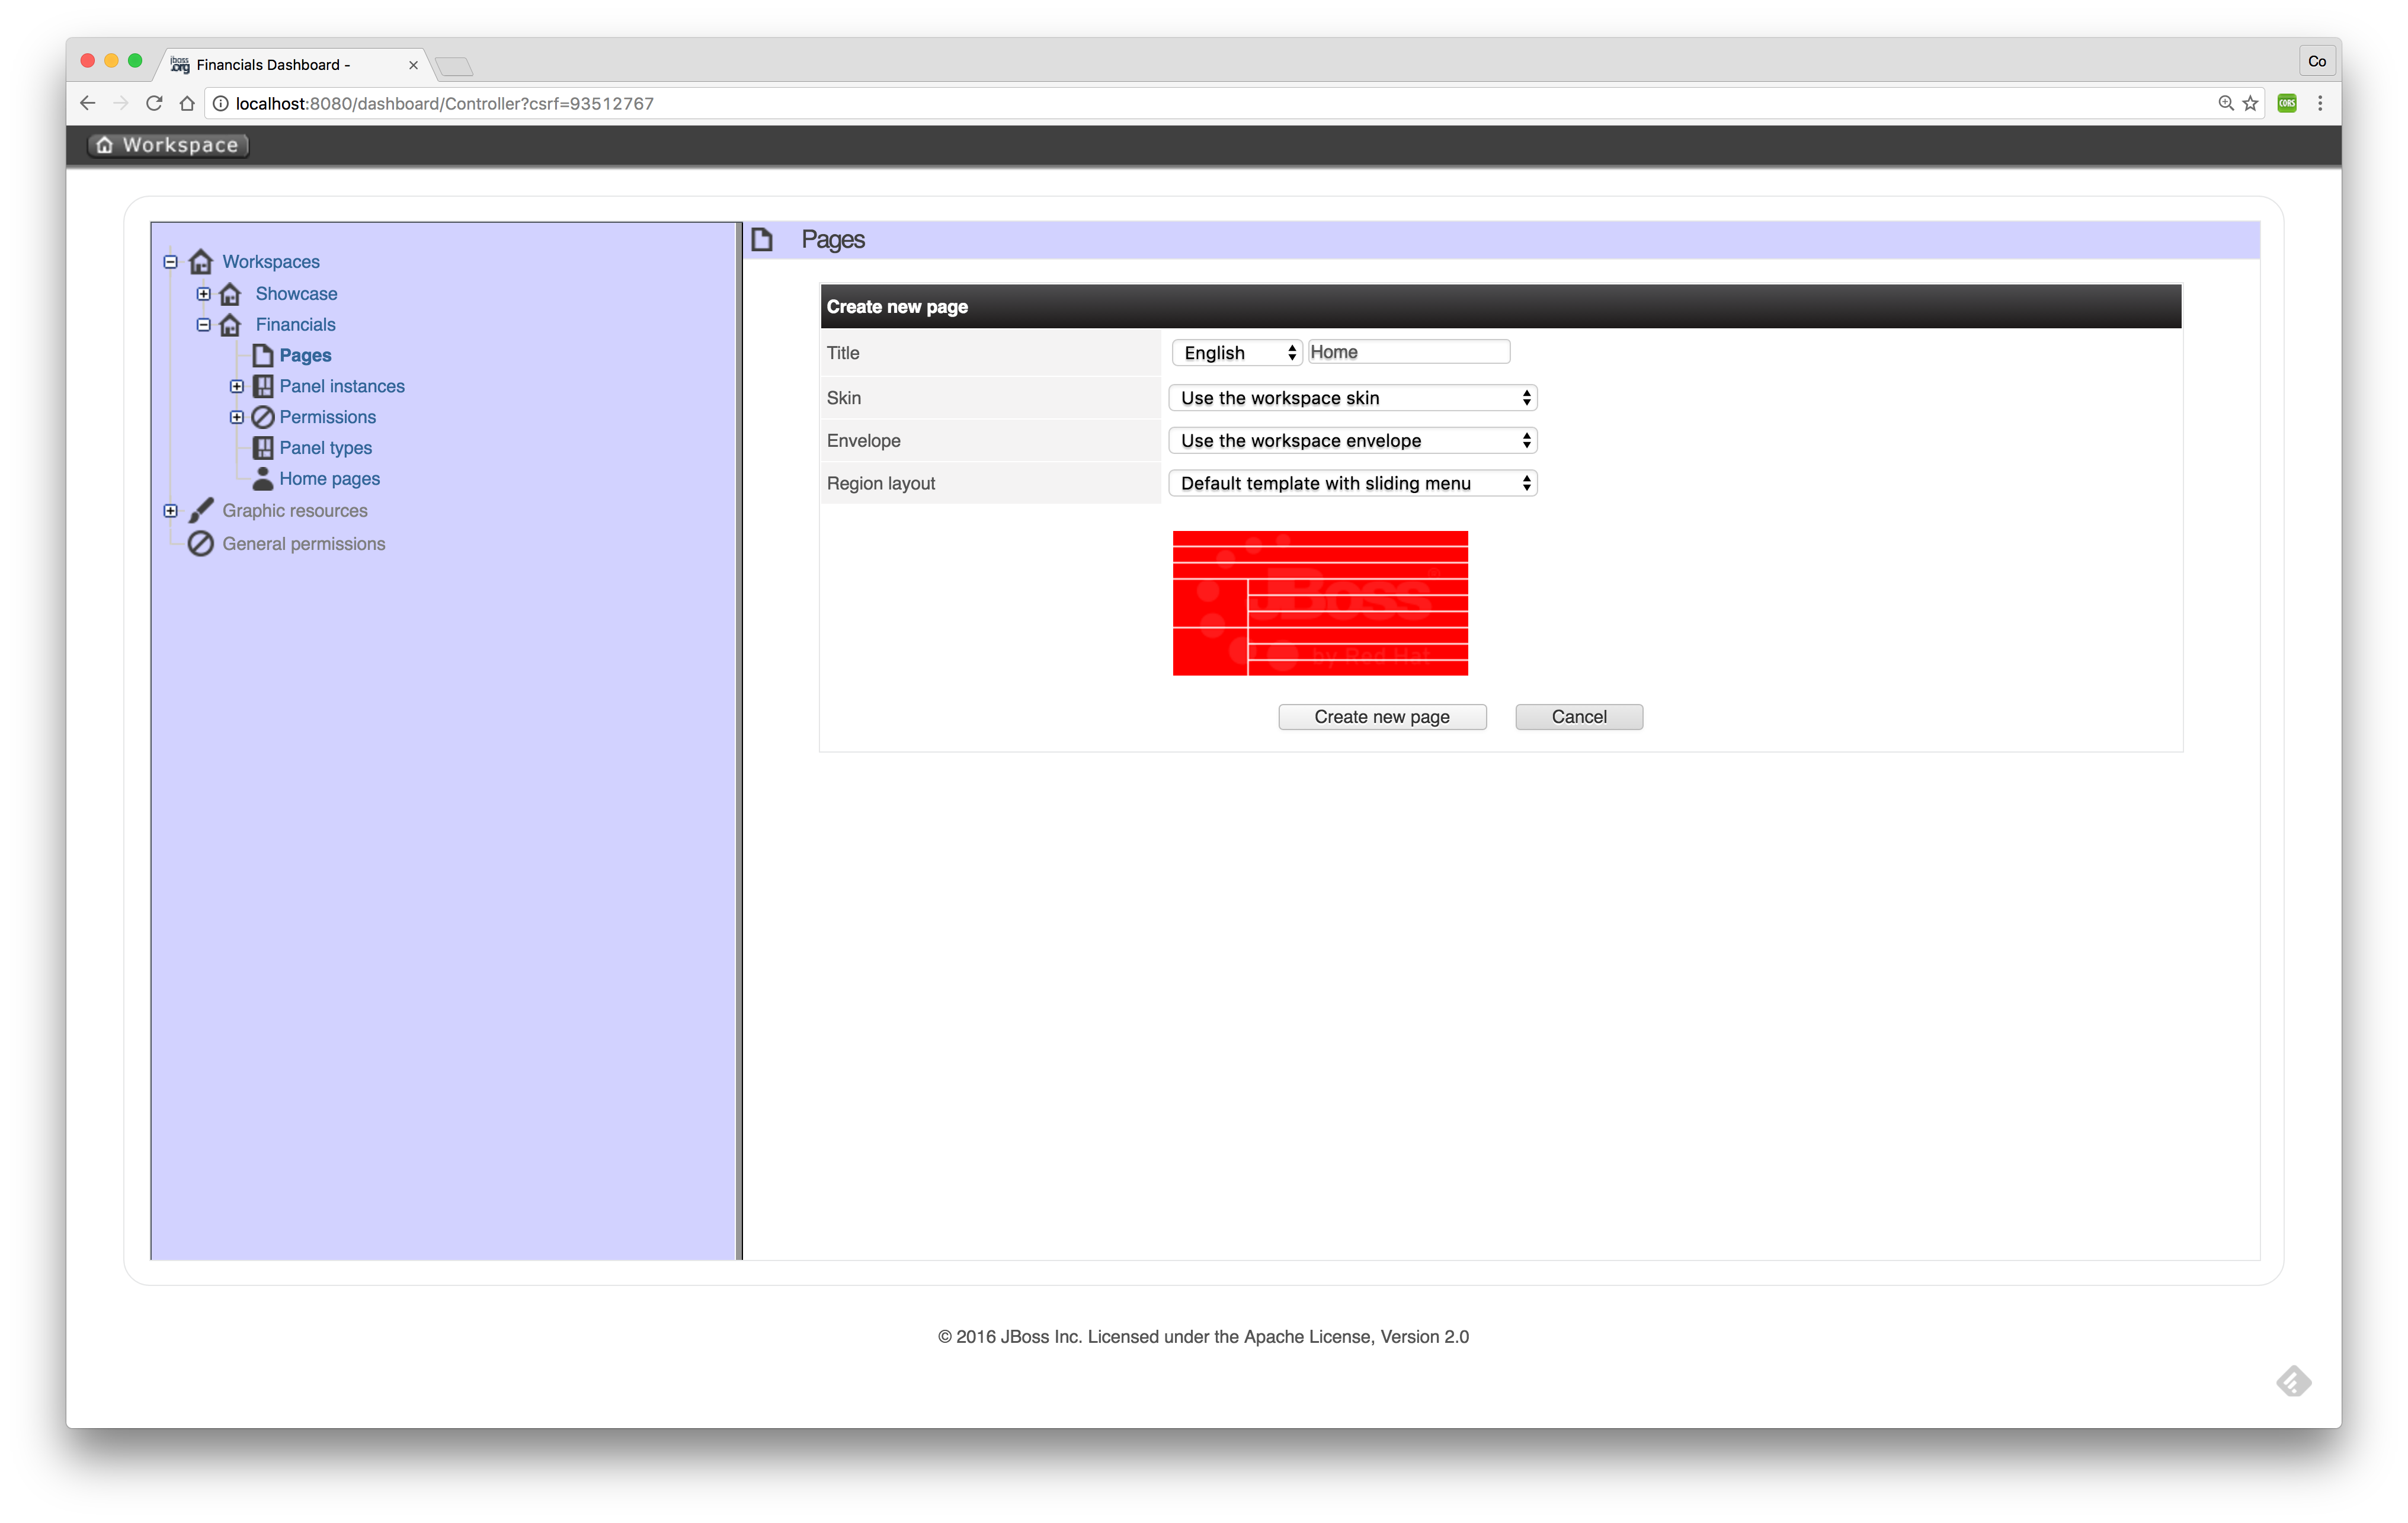
Use the settings as described above.
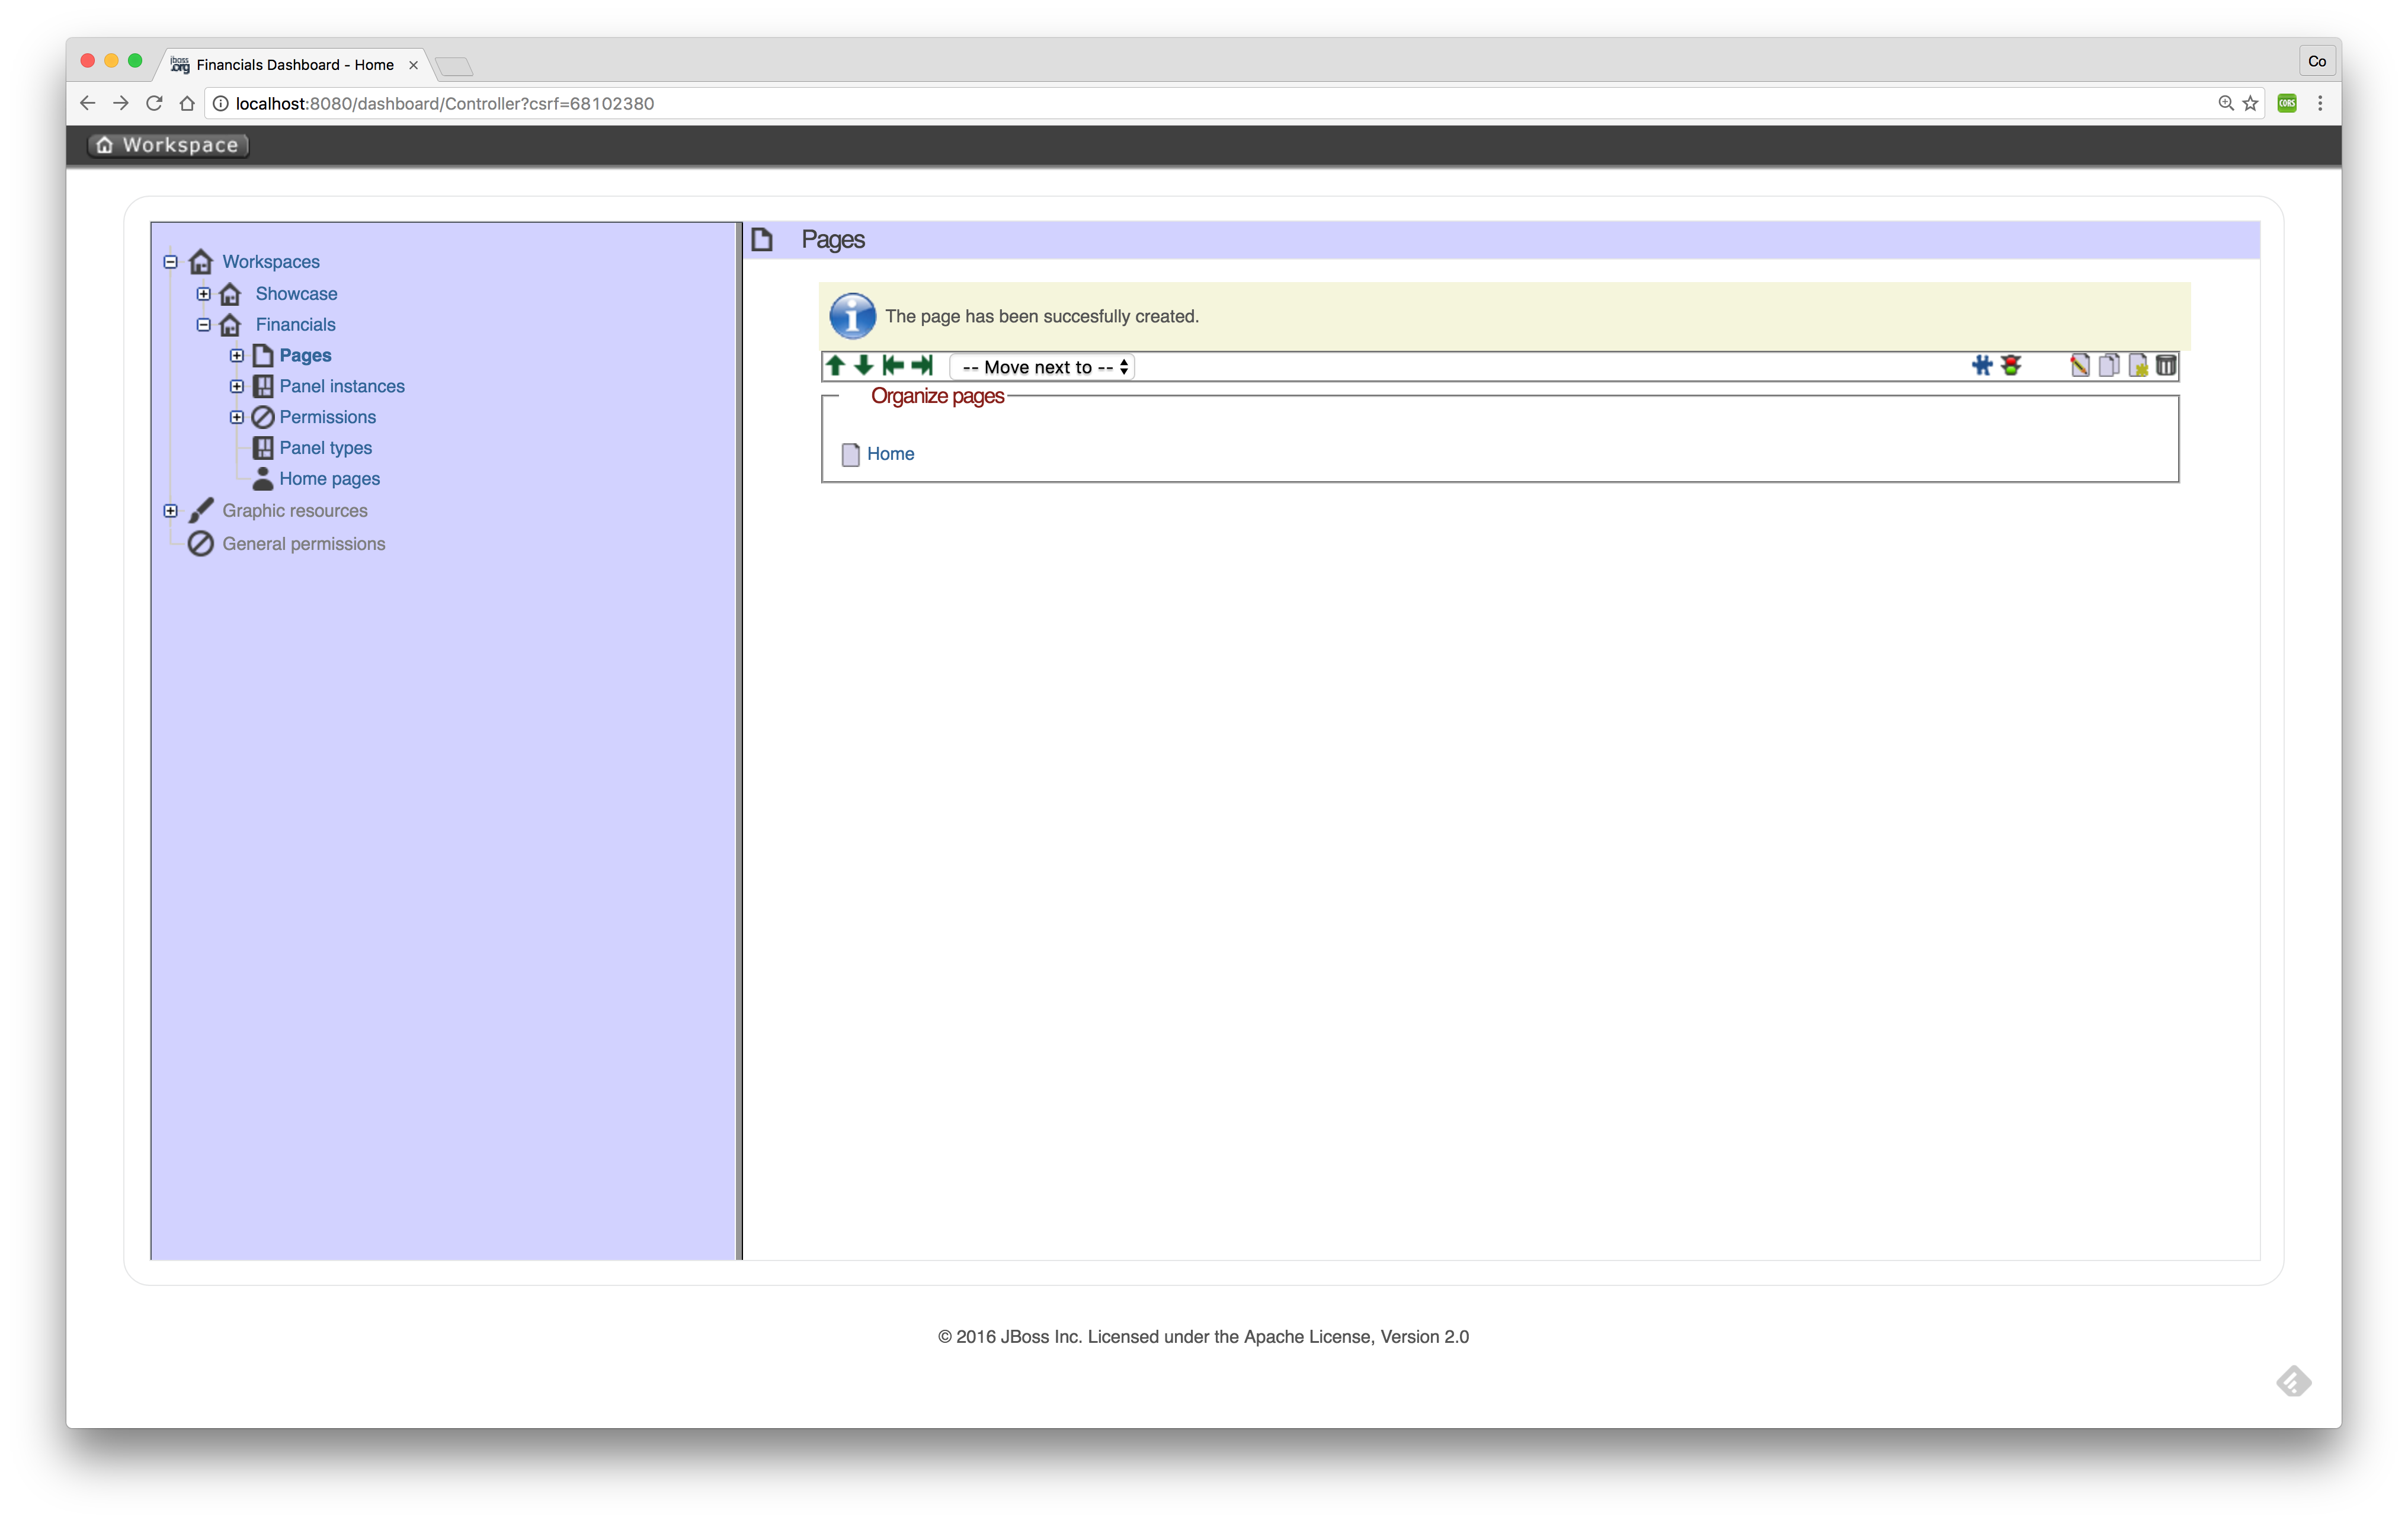
Now that the page is successfully created we can add a panel to it.
-
Add a panel

Select component "Tree menu" in the Navigation option and drag and drop the Create panel to the LEFT_TOP region of the page. The page should look similar to the following screen:
Add other components in the same way in the page like:
-
"Logout panel" in the HEADER_RIGHT-TOP region
-
"HTML Editor" in the CENTER_1 region
The HTML editor component provides the functionality (free HTML) to create a nice landing page in the dashboard.
-
Add KPI
Select component Key Performance Indicator in the Dashboard option and drag and drop the Create panel to the CENTER_2 region. The page should look similar to the following screen:

Select FinancialsData as the Data provider. Type a name in the KPI’s name field i.e. #customers per country. Select country for Domain aka X Axis. Select customerid for Range aka Y Axis. Select NVD3 for Renderer. Select Value for Sort Interval By. Select Ascendant for Sort Order.

Now try to add some extra pages/panels yourself.
Financials Dashboard Demo
Existing dashboards can exported/imported in Dashboard Builder. To showcase the Dashboard Builder features, we provide a sample Financials Dashboard.
-
Import Workspace
Go to the Showcase workspace as the active workspace. Select menu:Administration[Import and Export] and the following screen appears.
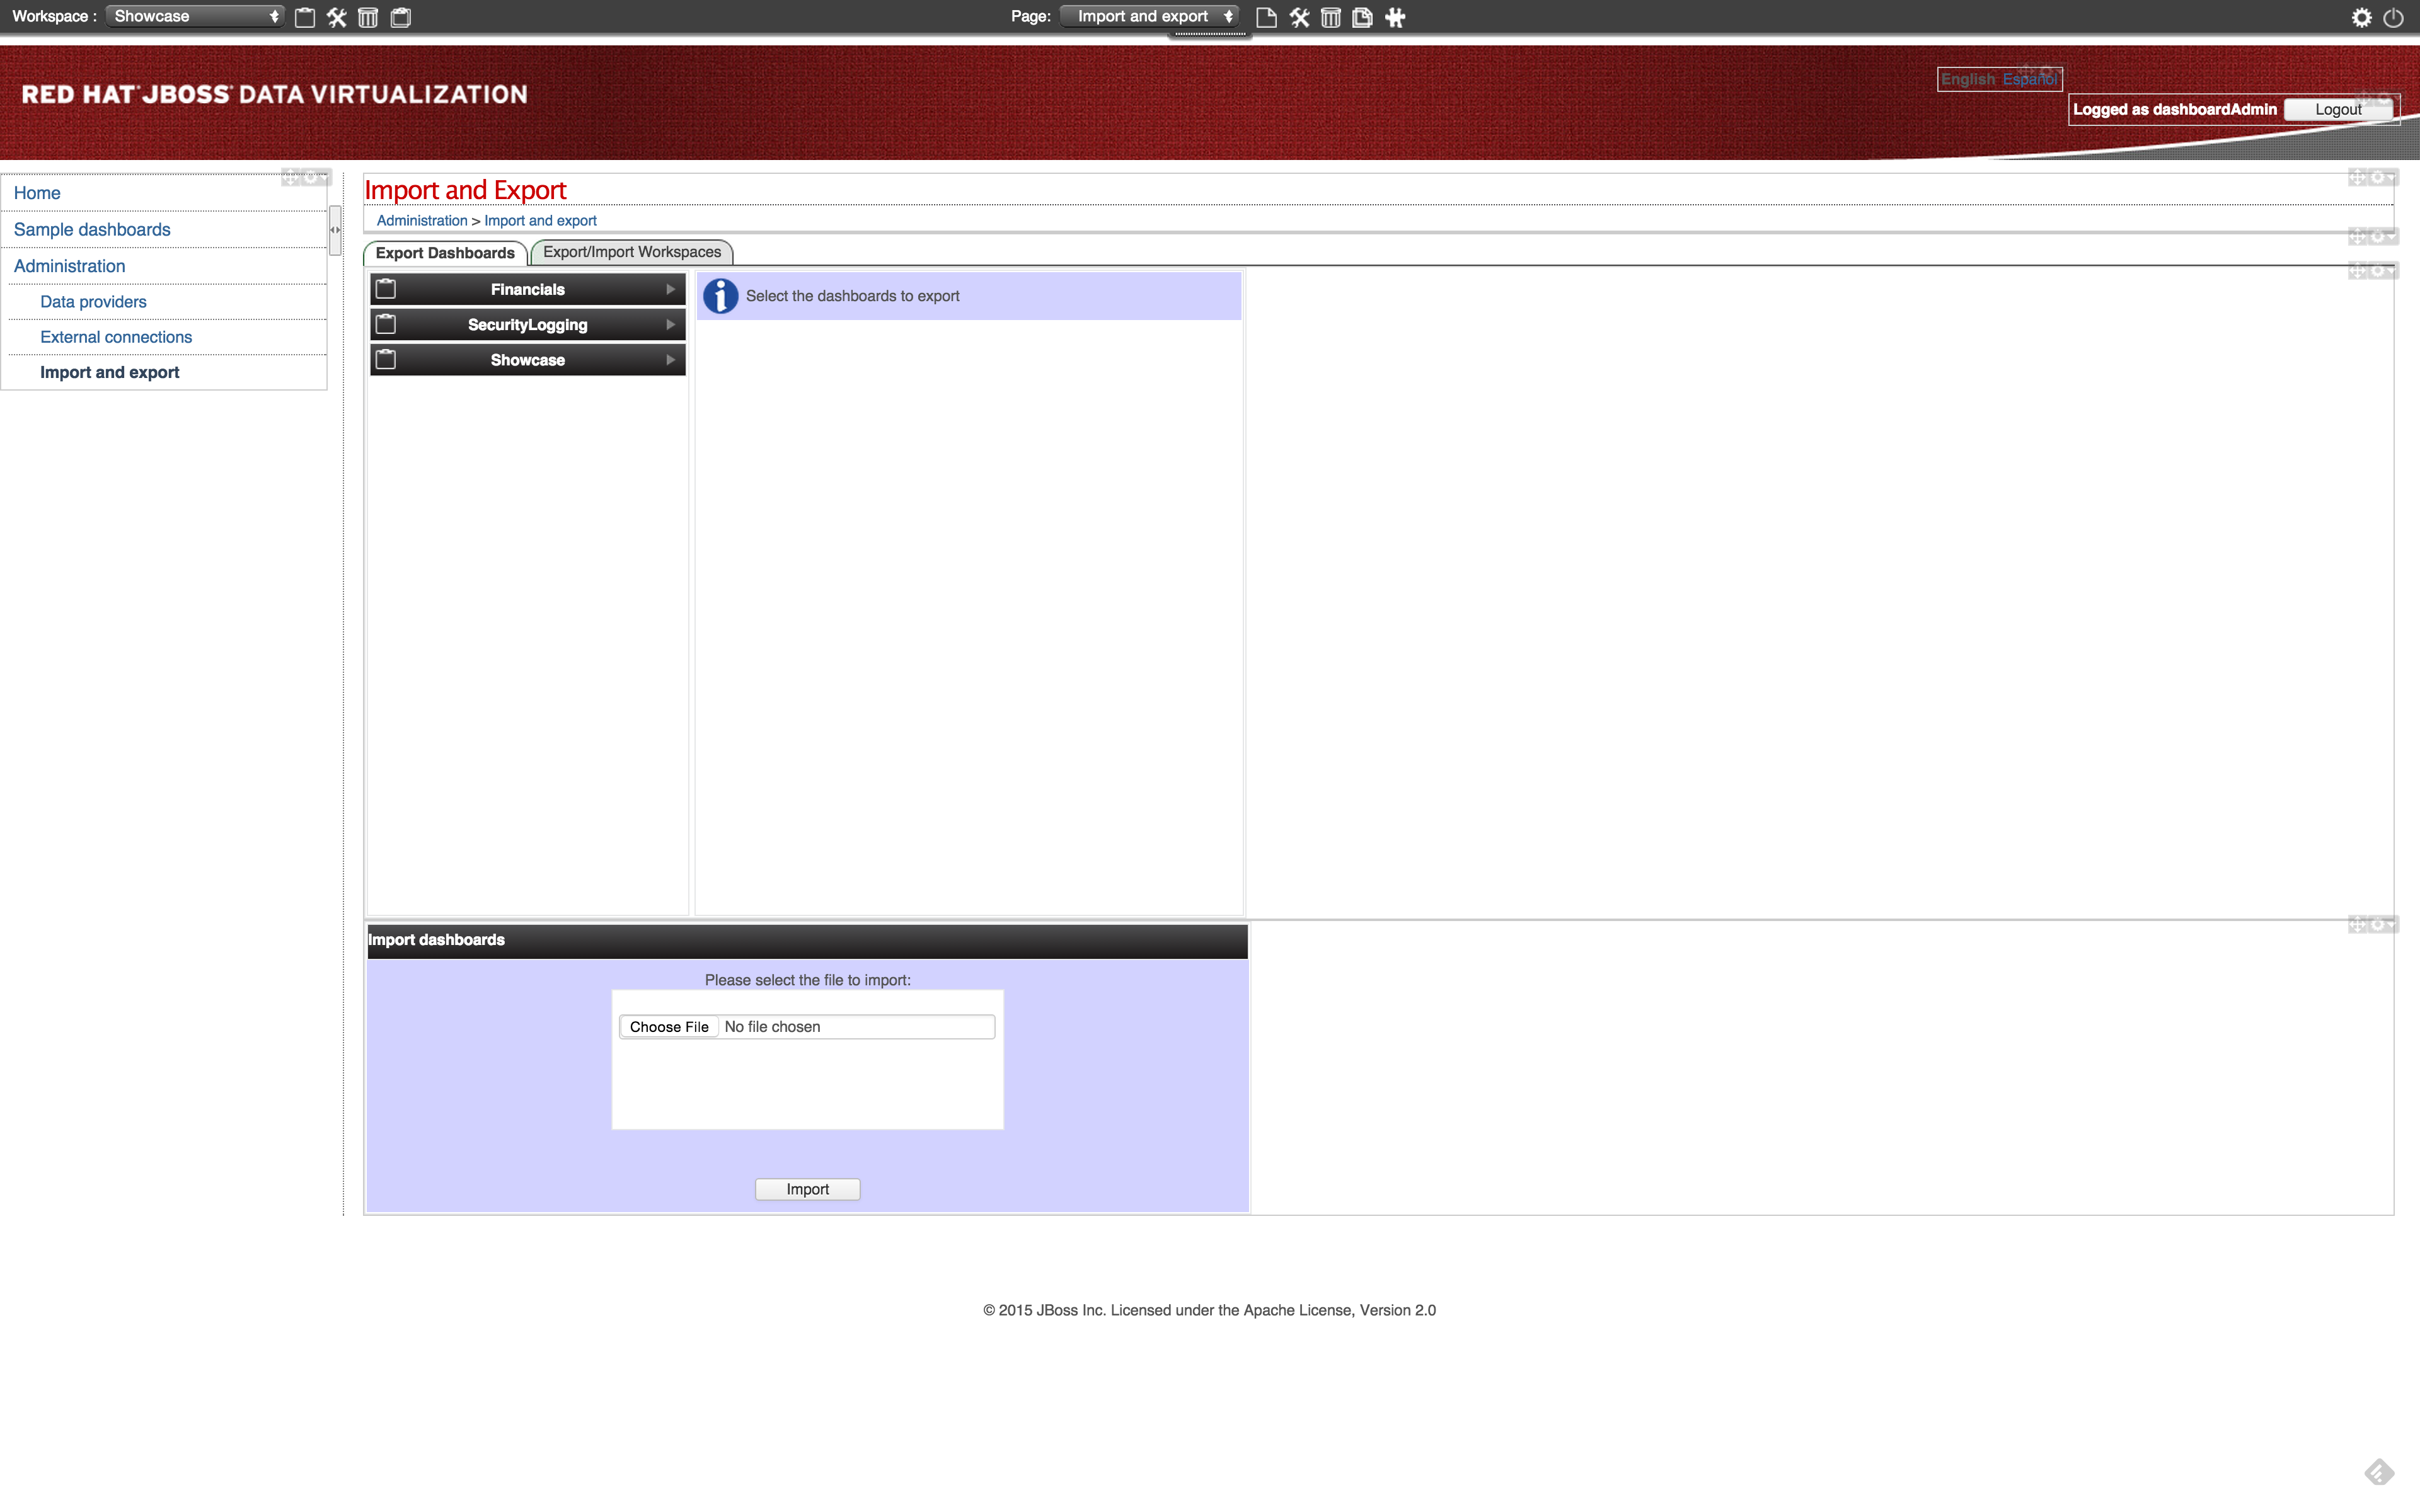
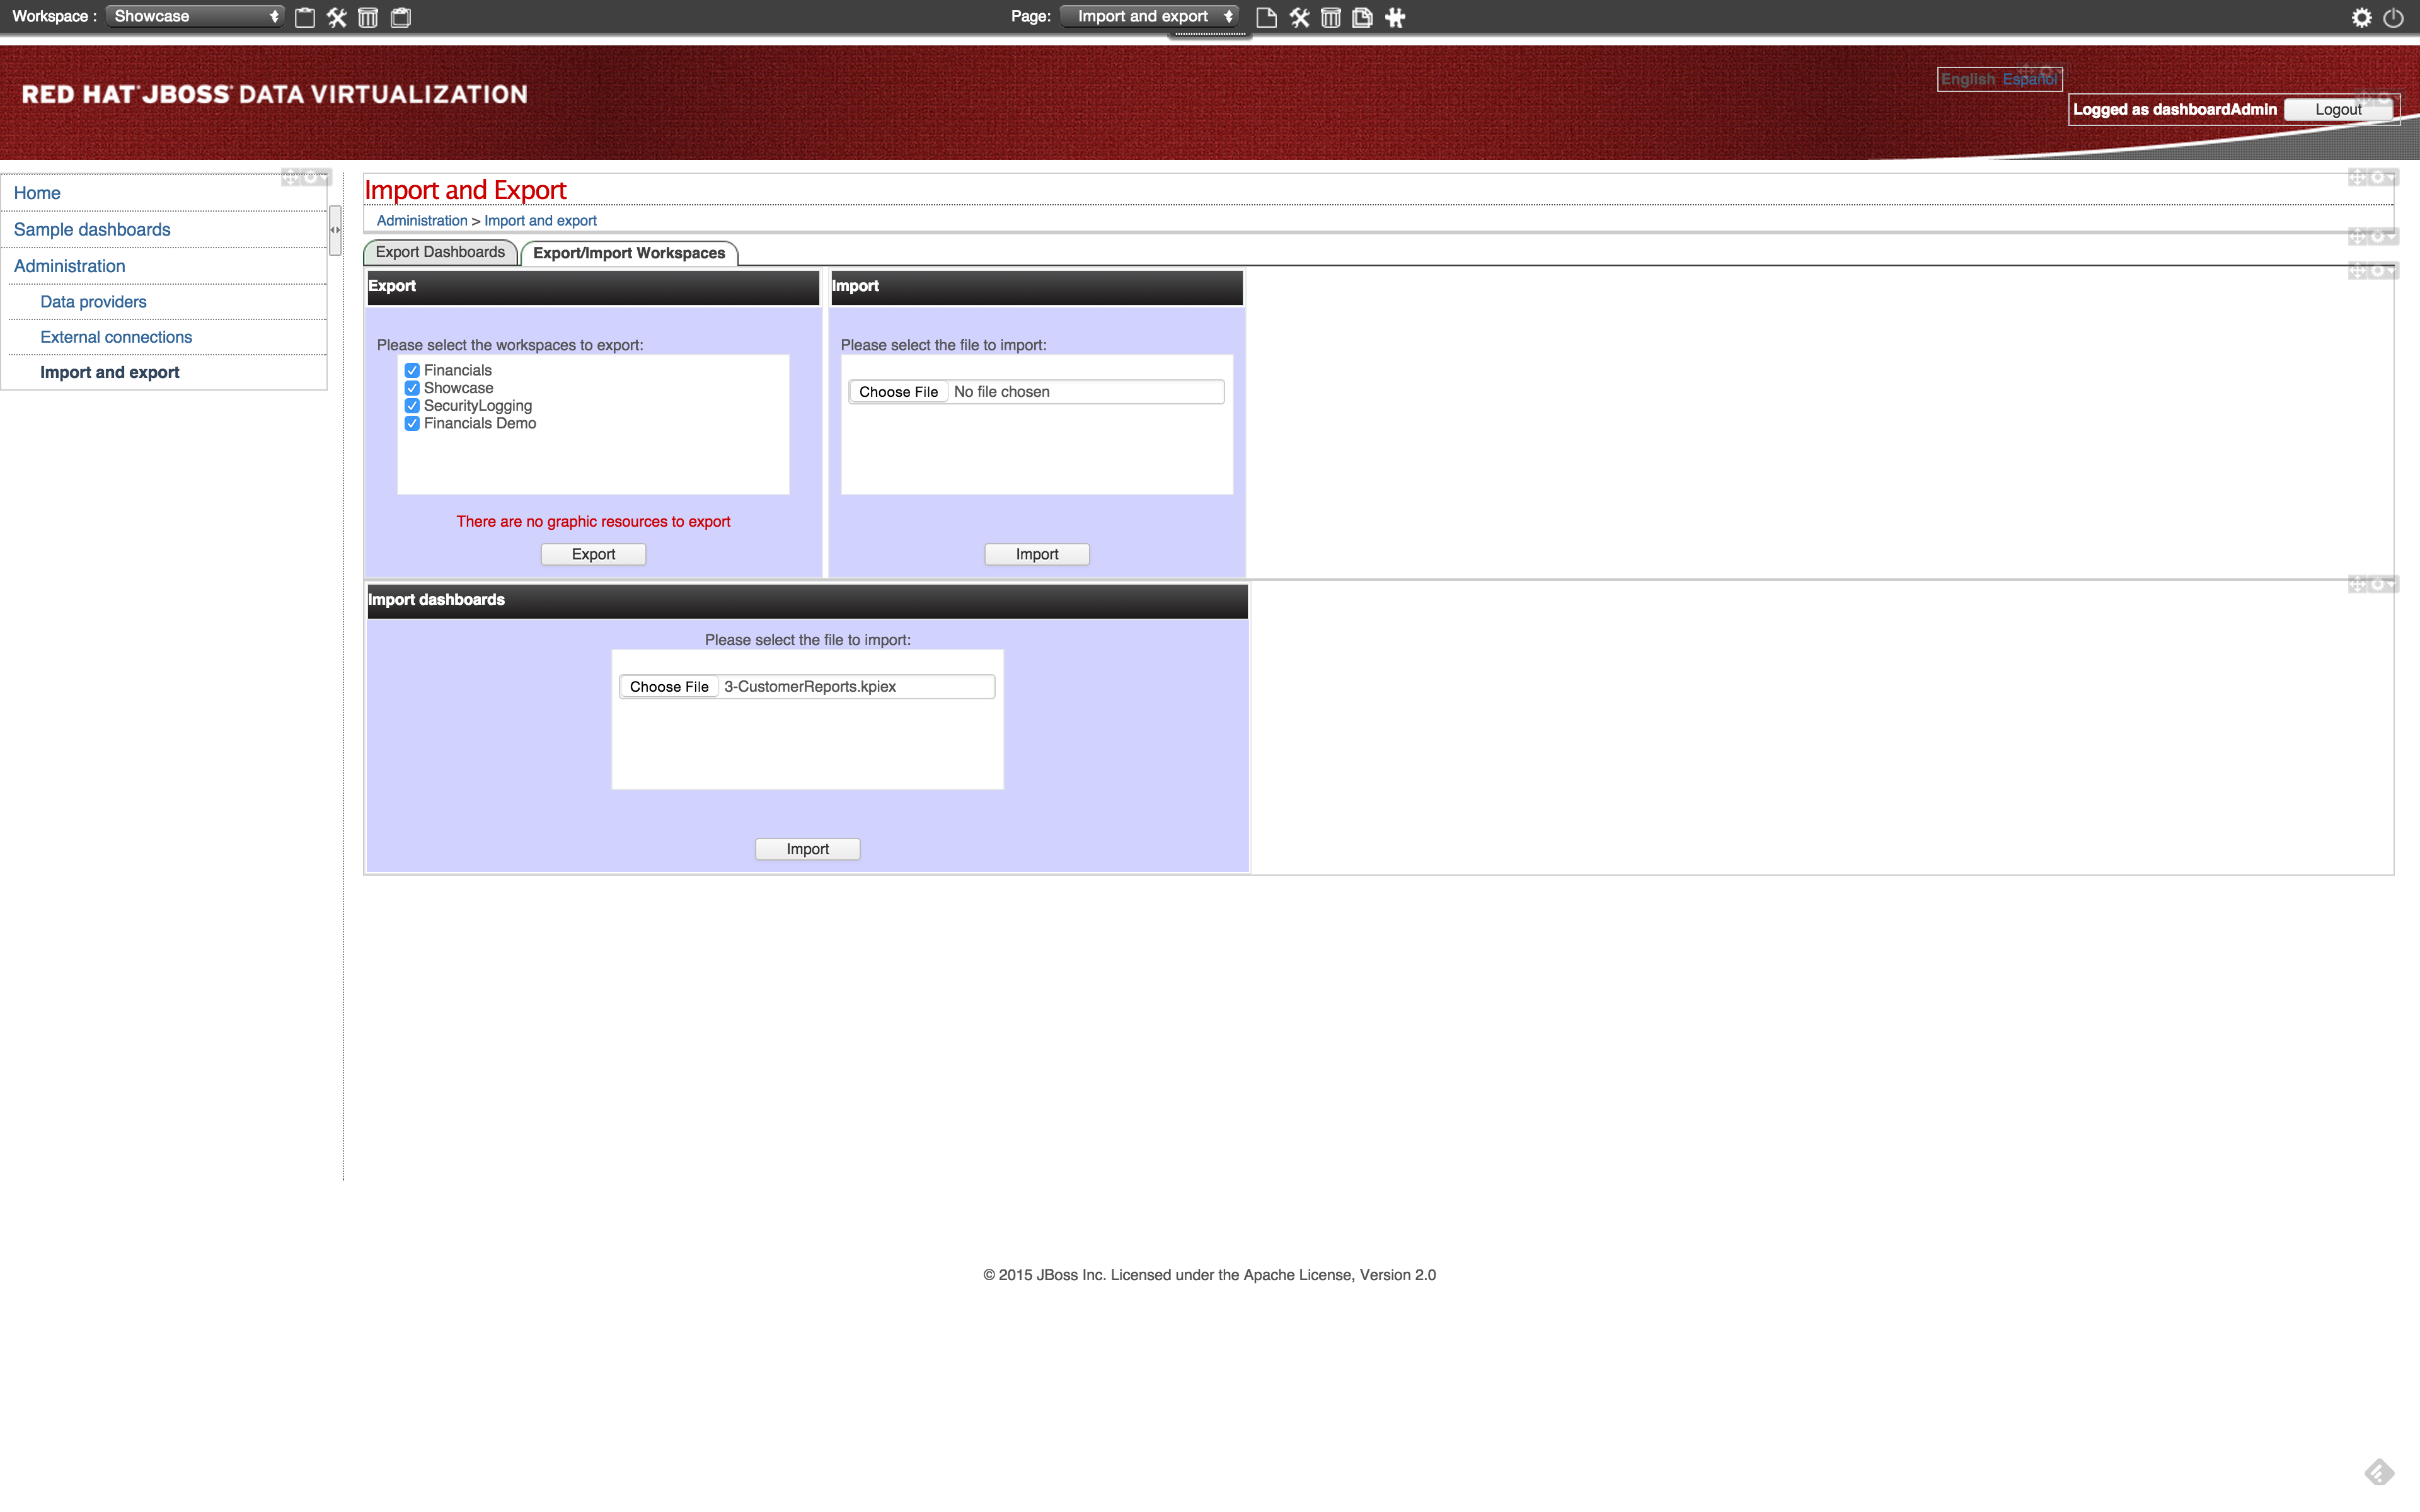
Click the Export/Import Workspaces tab and the following screen should appear.

Click the btn:[Choose file] in the Import region. Select the 2-WorkspaceFinancials.cex file in the DVWorkshop/dv-docker/demo/dashboard directory.
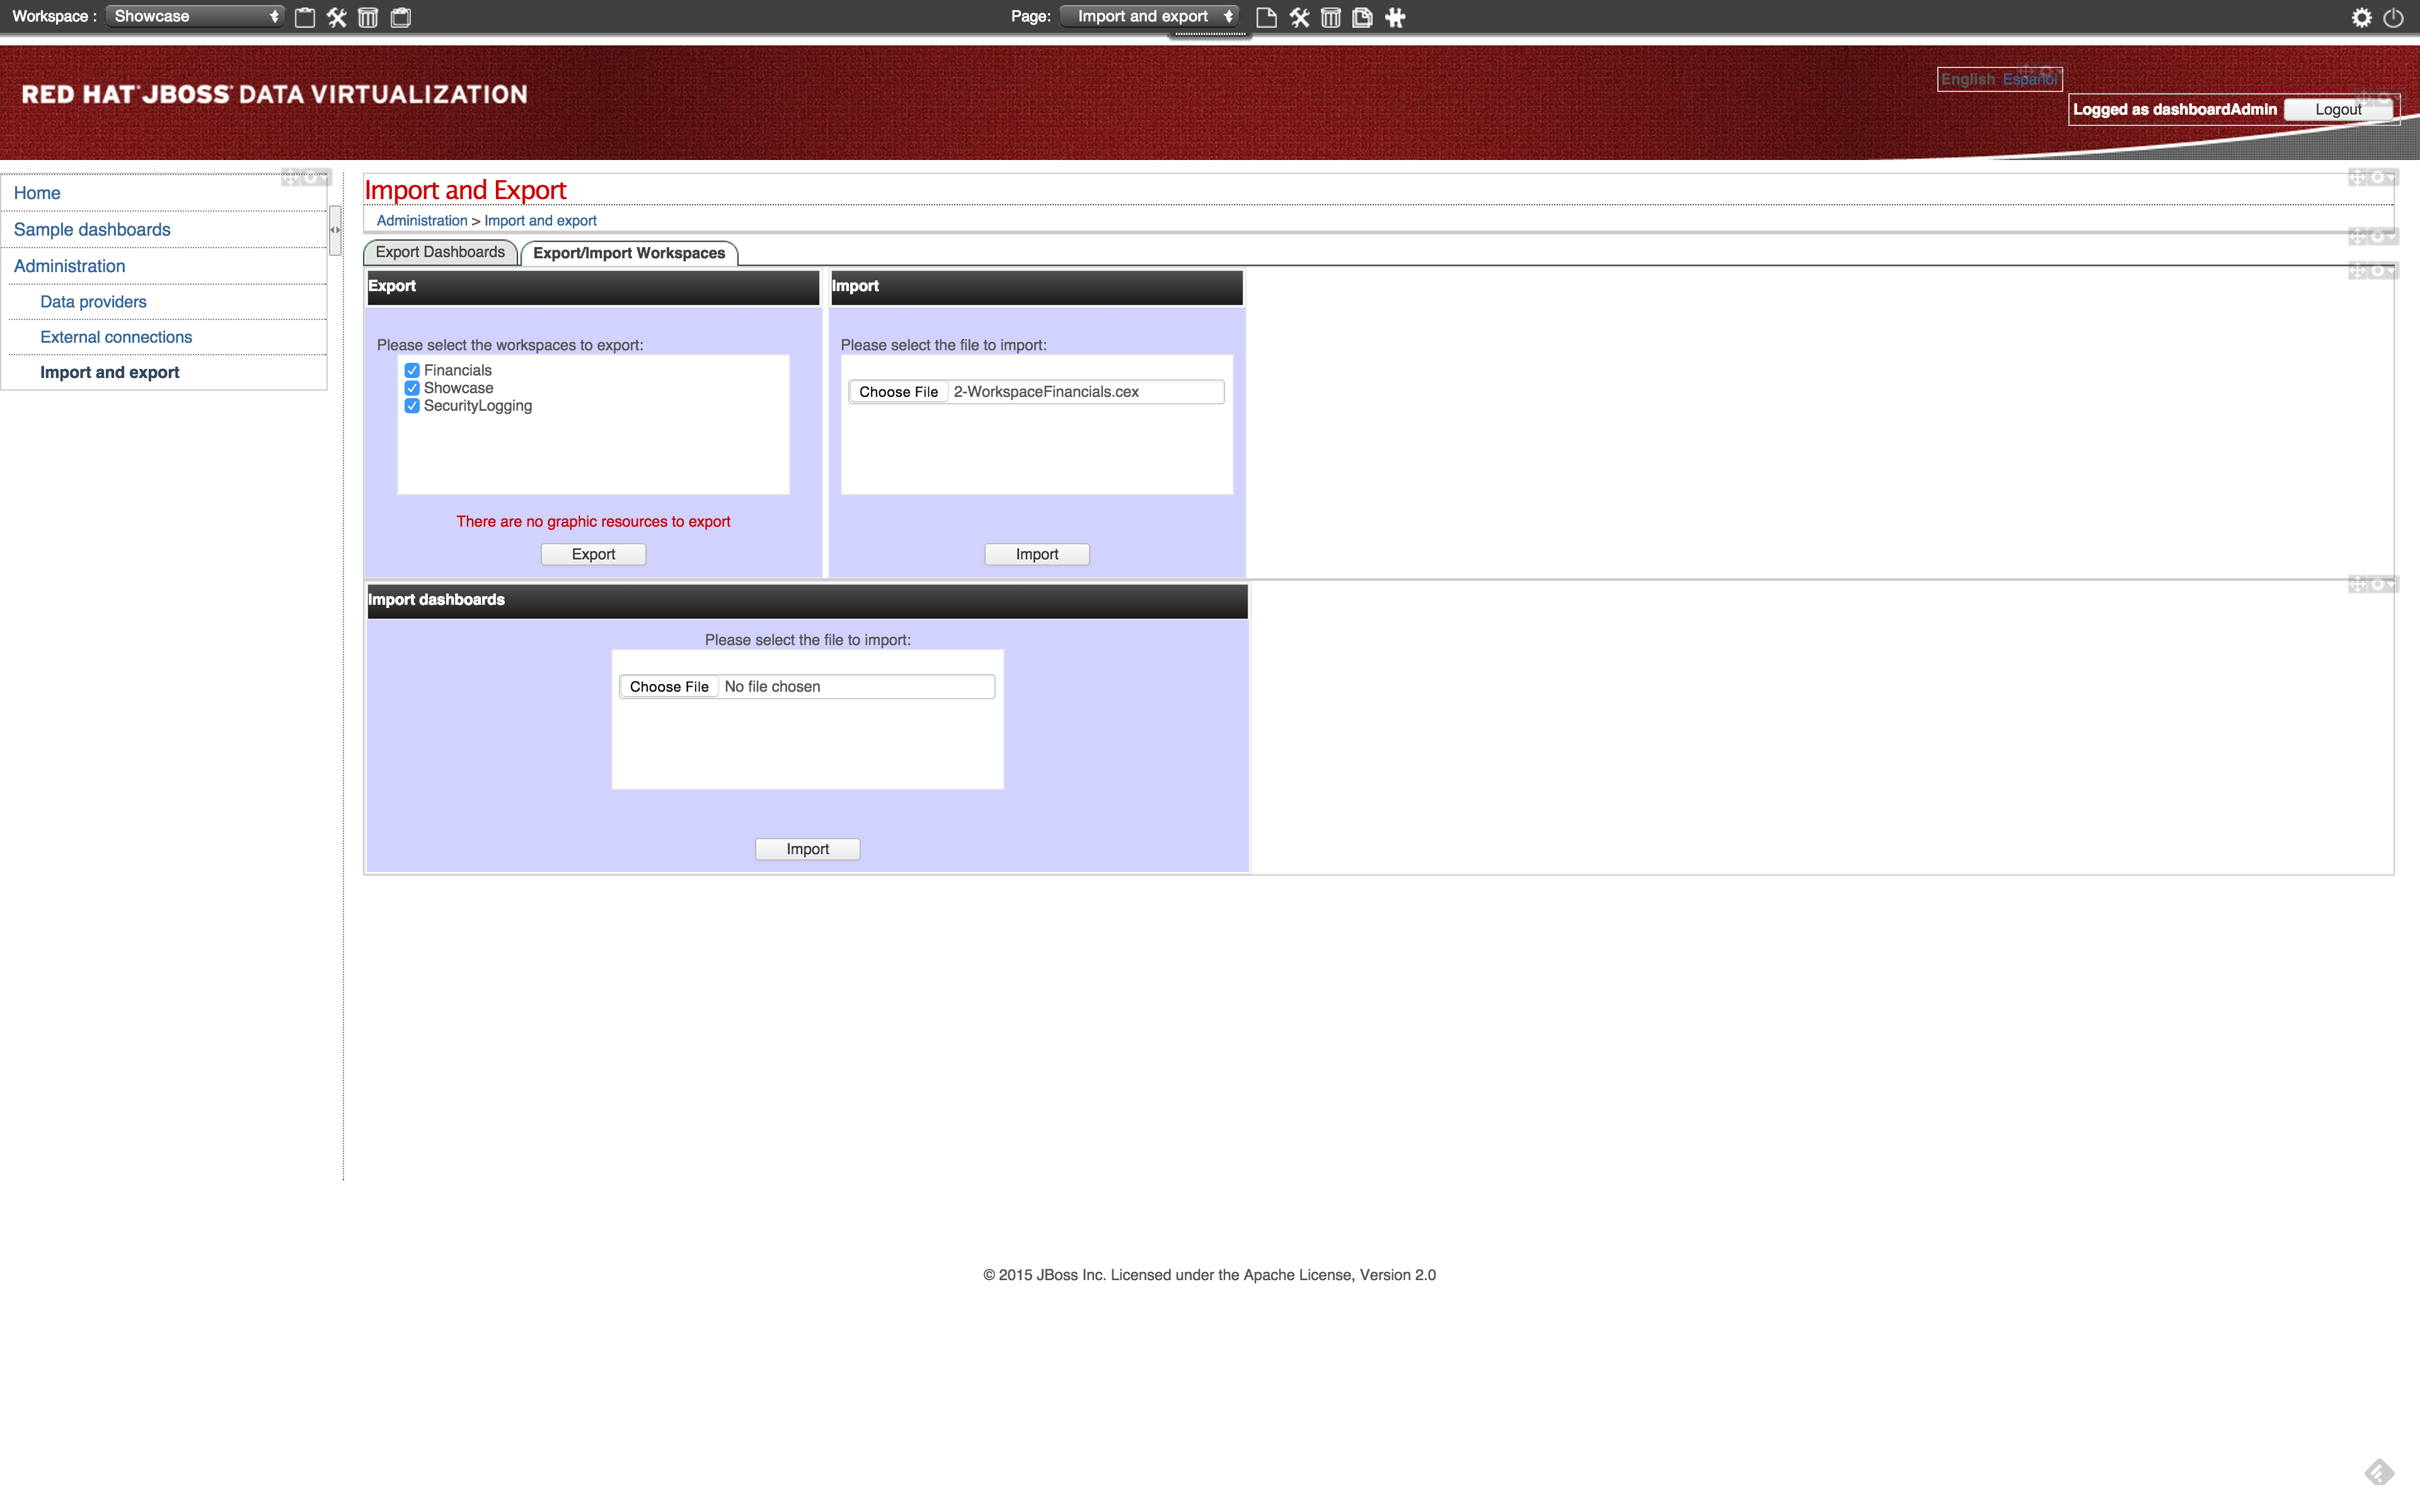
Click btn:[Import]. In the next screen you get the Select objects to import step. Make sure WORKSPACE: 0 is selected.
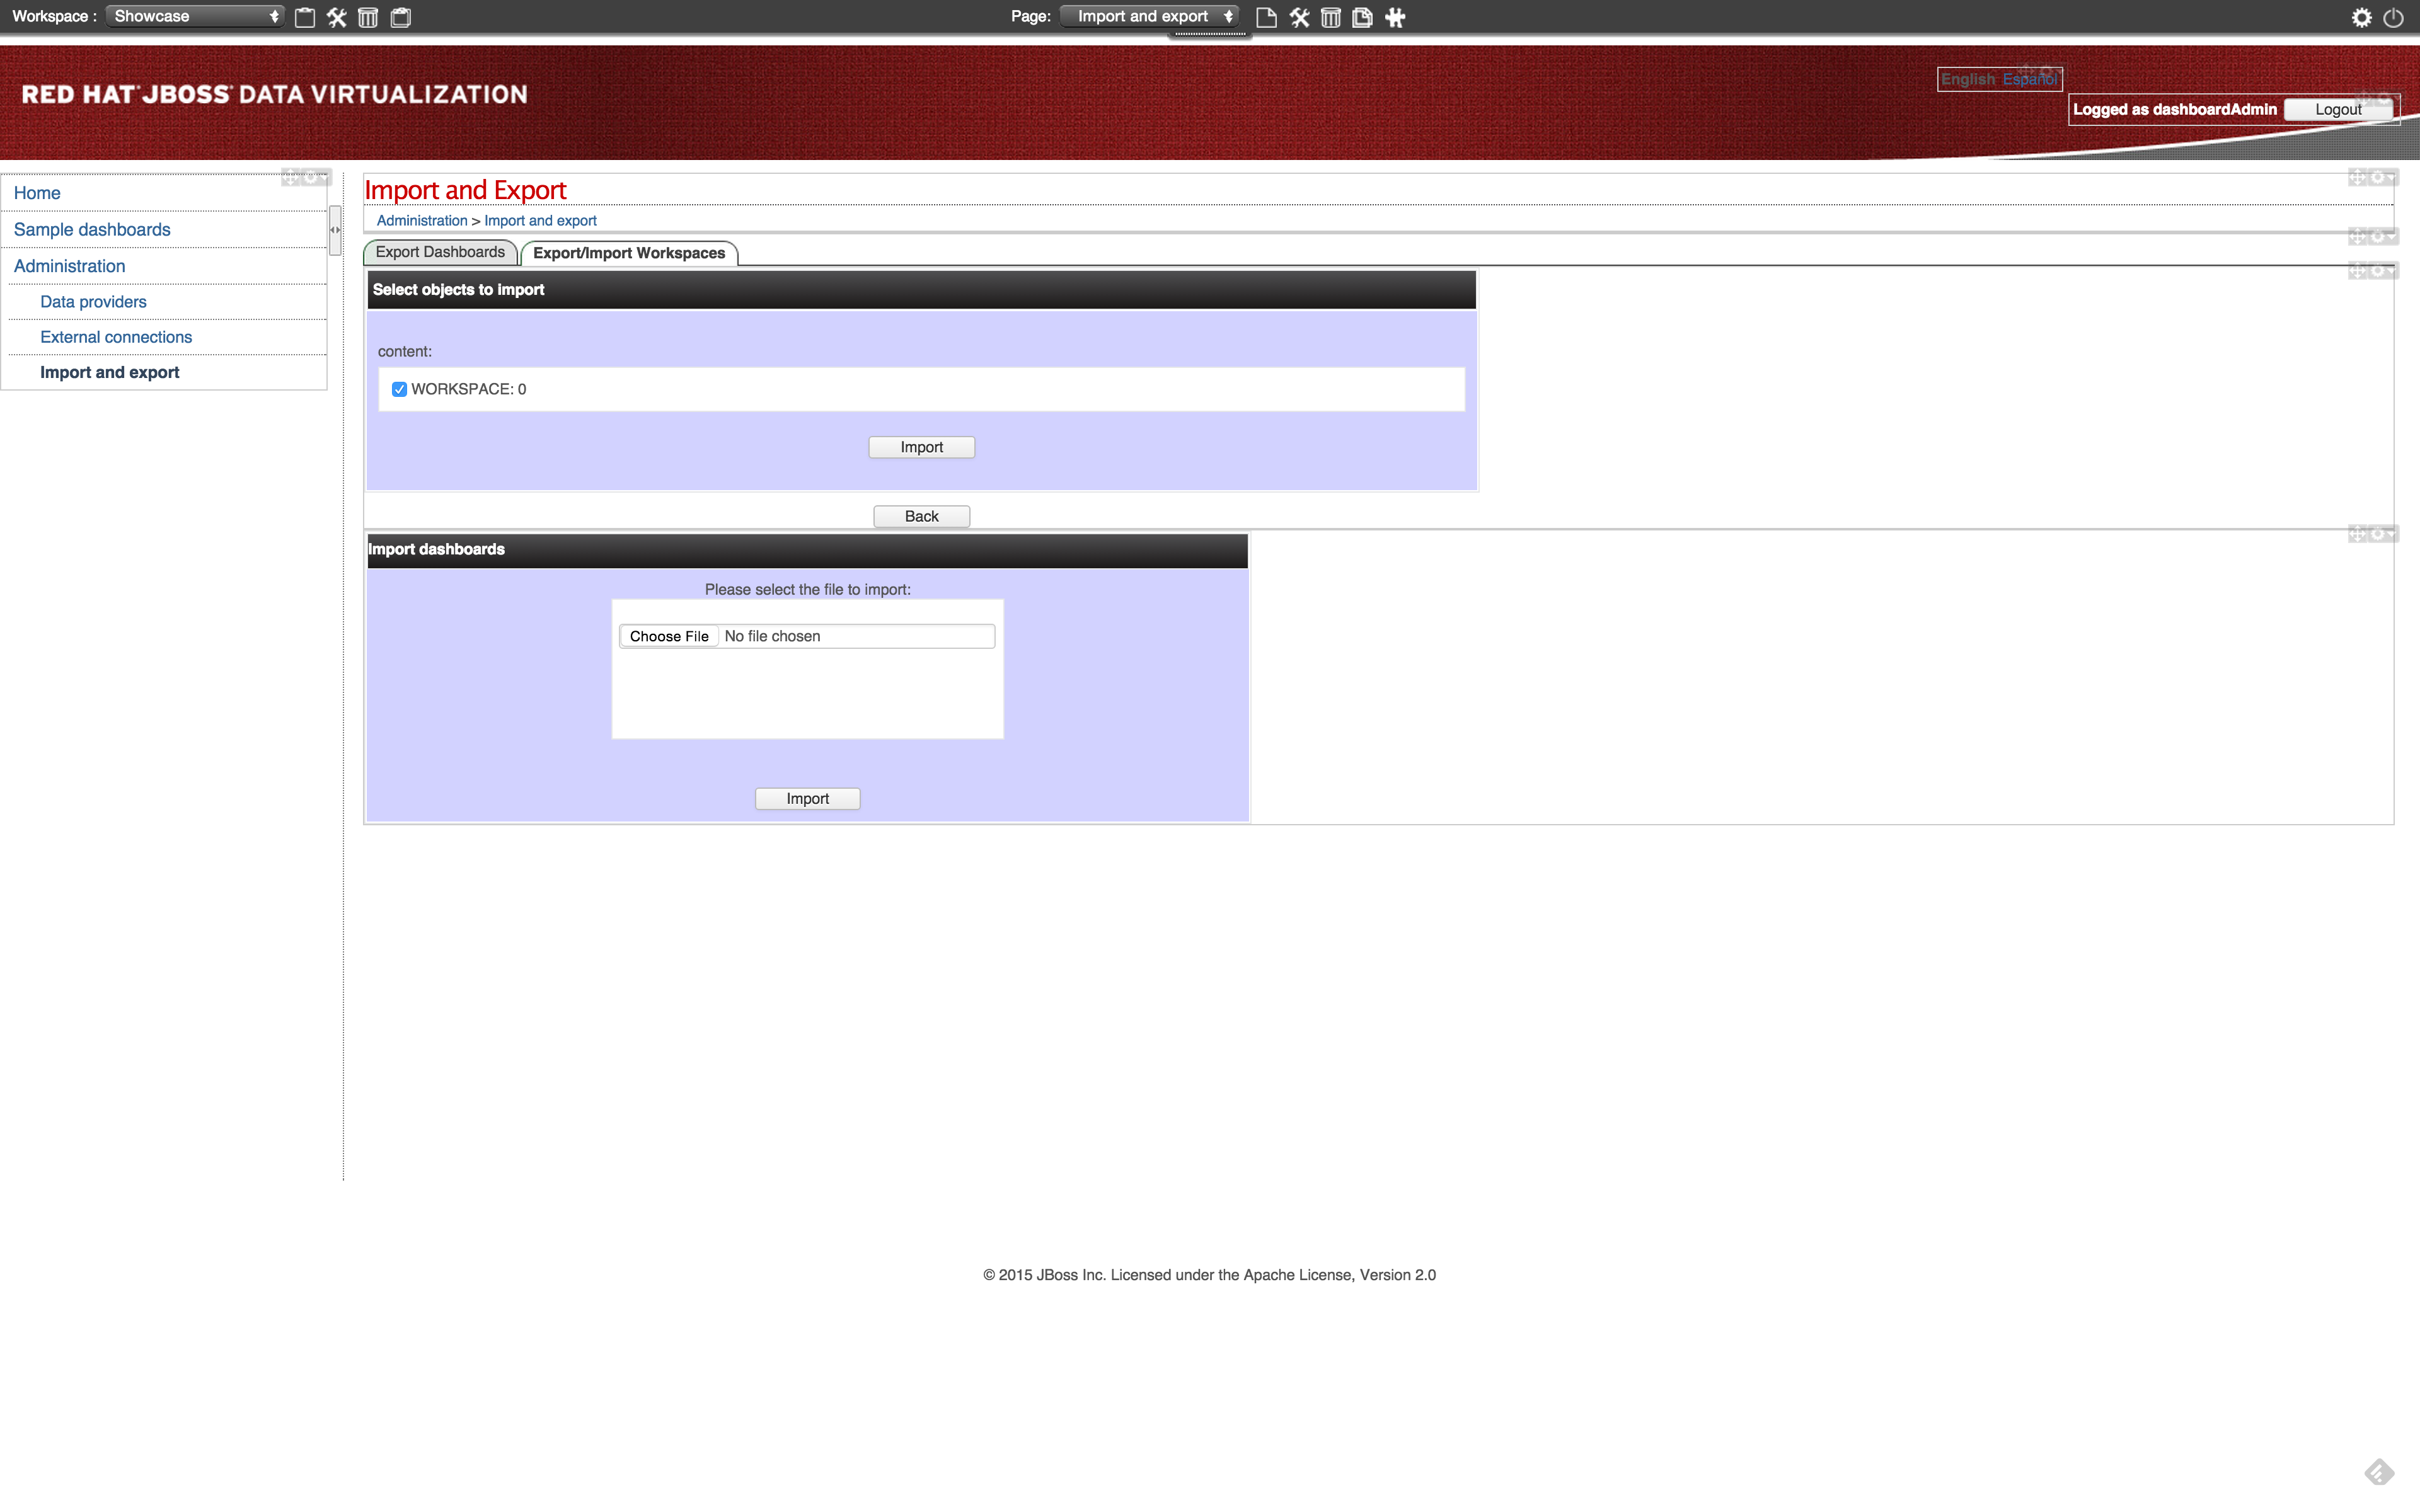
Click btn:[Import] in the Select objects to import region. The import of the workspace should be successful and the screen should look like the following.

-
Import Dashboards
Select the Showcase workspace as the active workspace. Select menu:Administration[Import and Export] and the following screen appears. Click the btn:[Choose file] in the Import dashboards region. Select the 3-CustomerReports.kpiex file in the DVWorkshop/dv-docker/demo/dashboard directory.
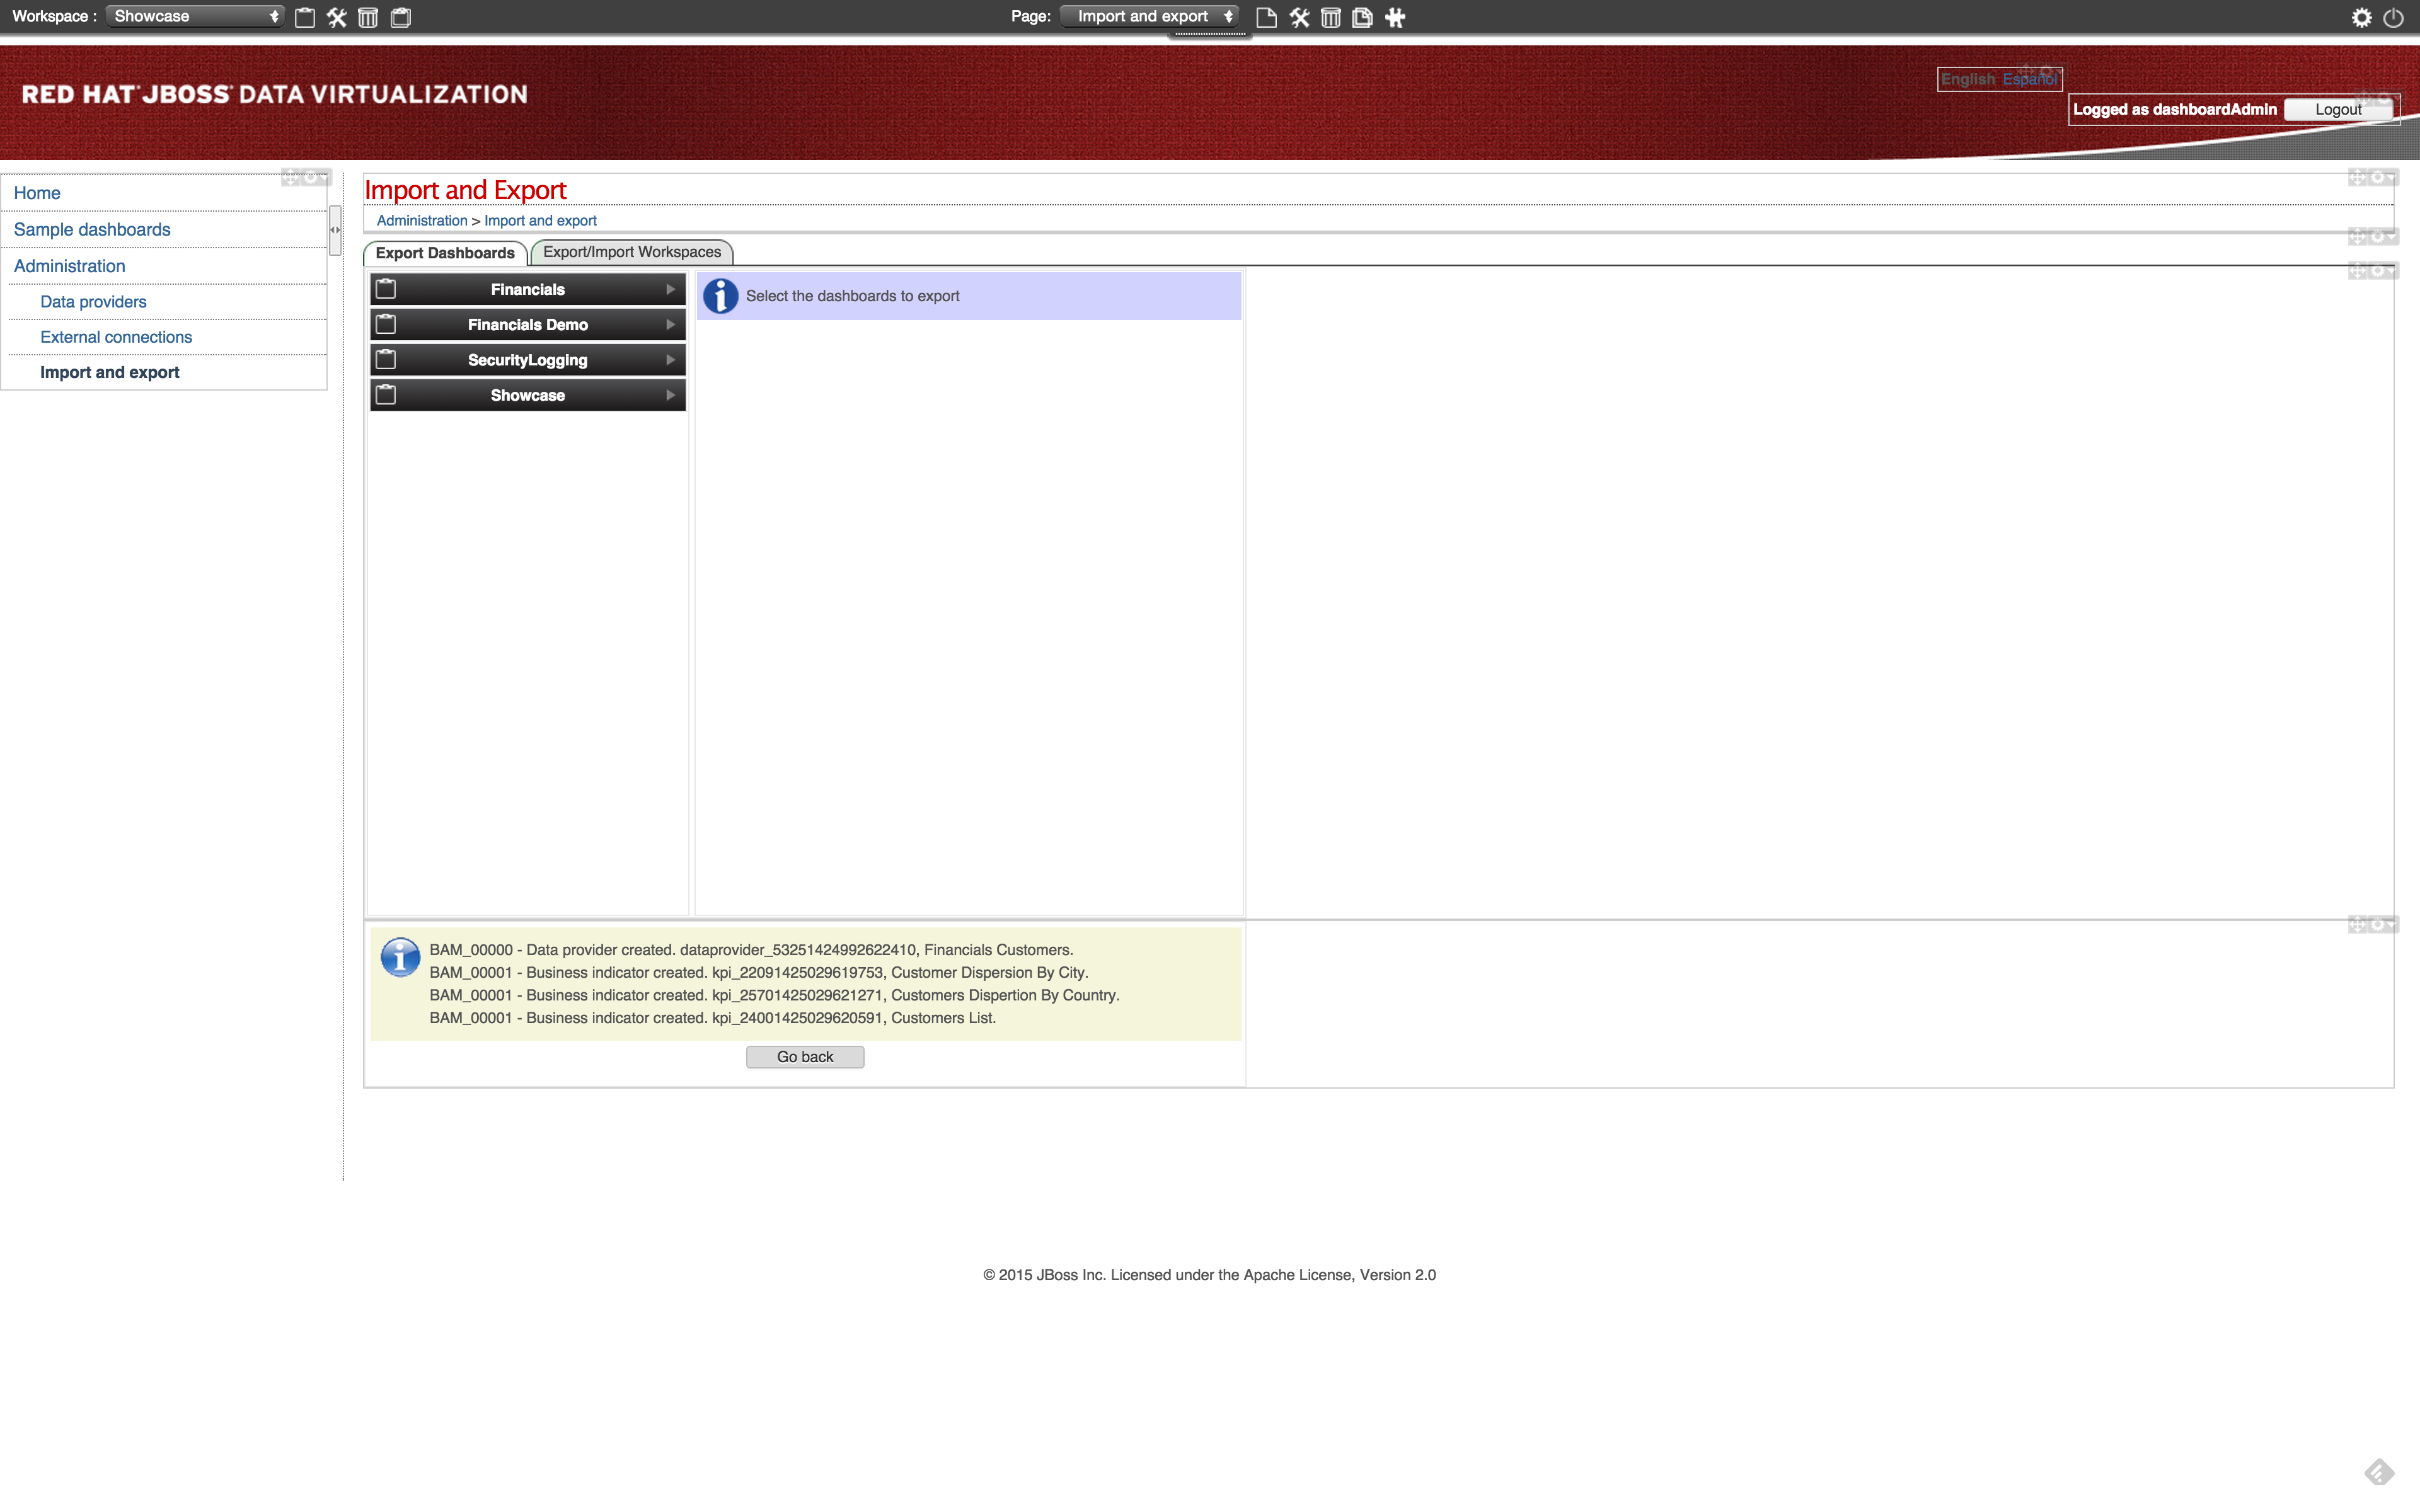
Click btn:[Import]. The import of the dashboard should be successful and the screen should like the following.
Repeat these steps for the other two dashboards:
-
4-AccountReports.kpiex
-
5-AccountHoldings.kpiex
-
Financials Demo Dashboard
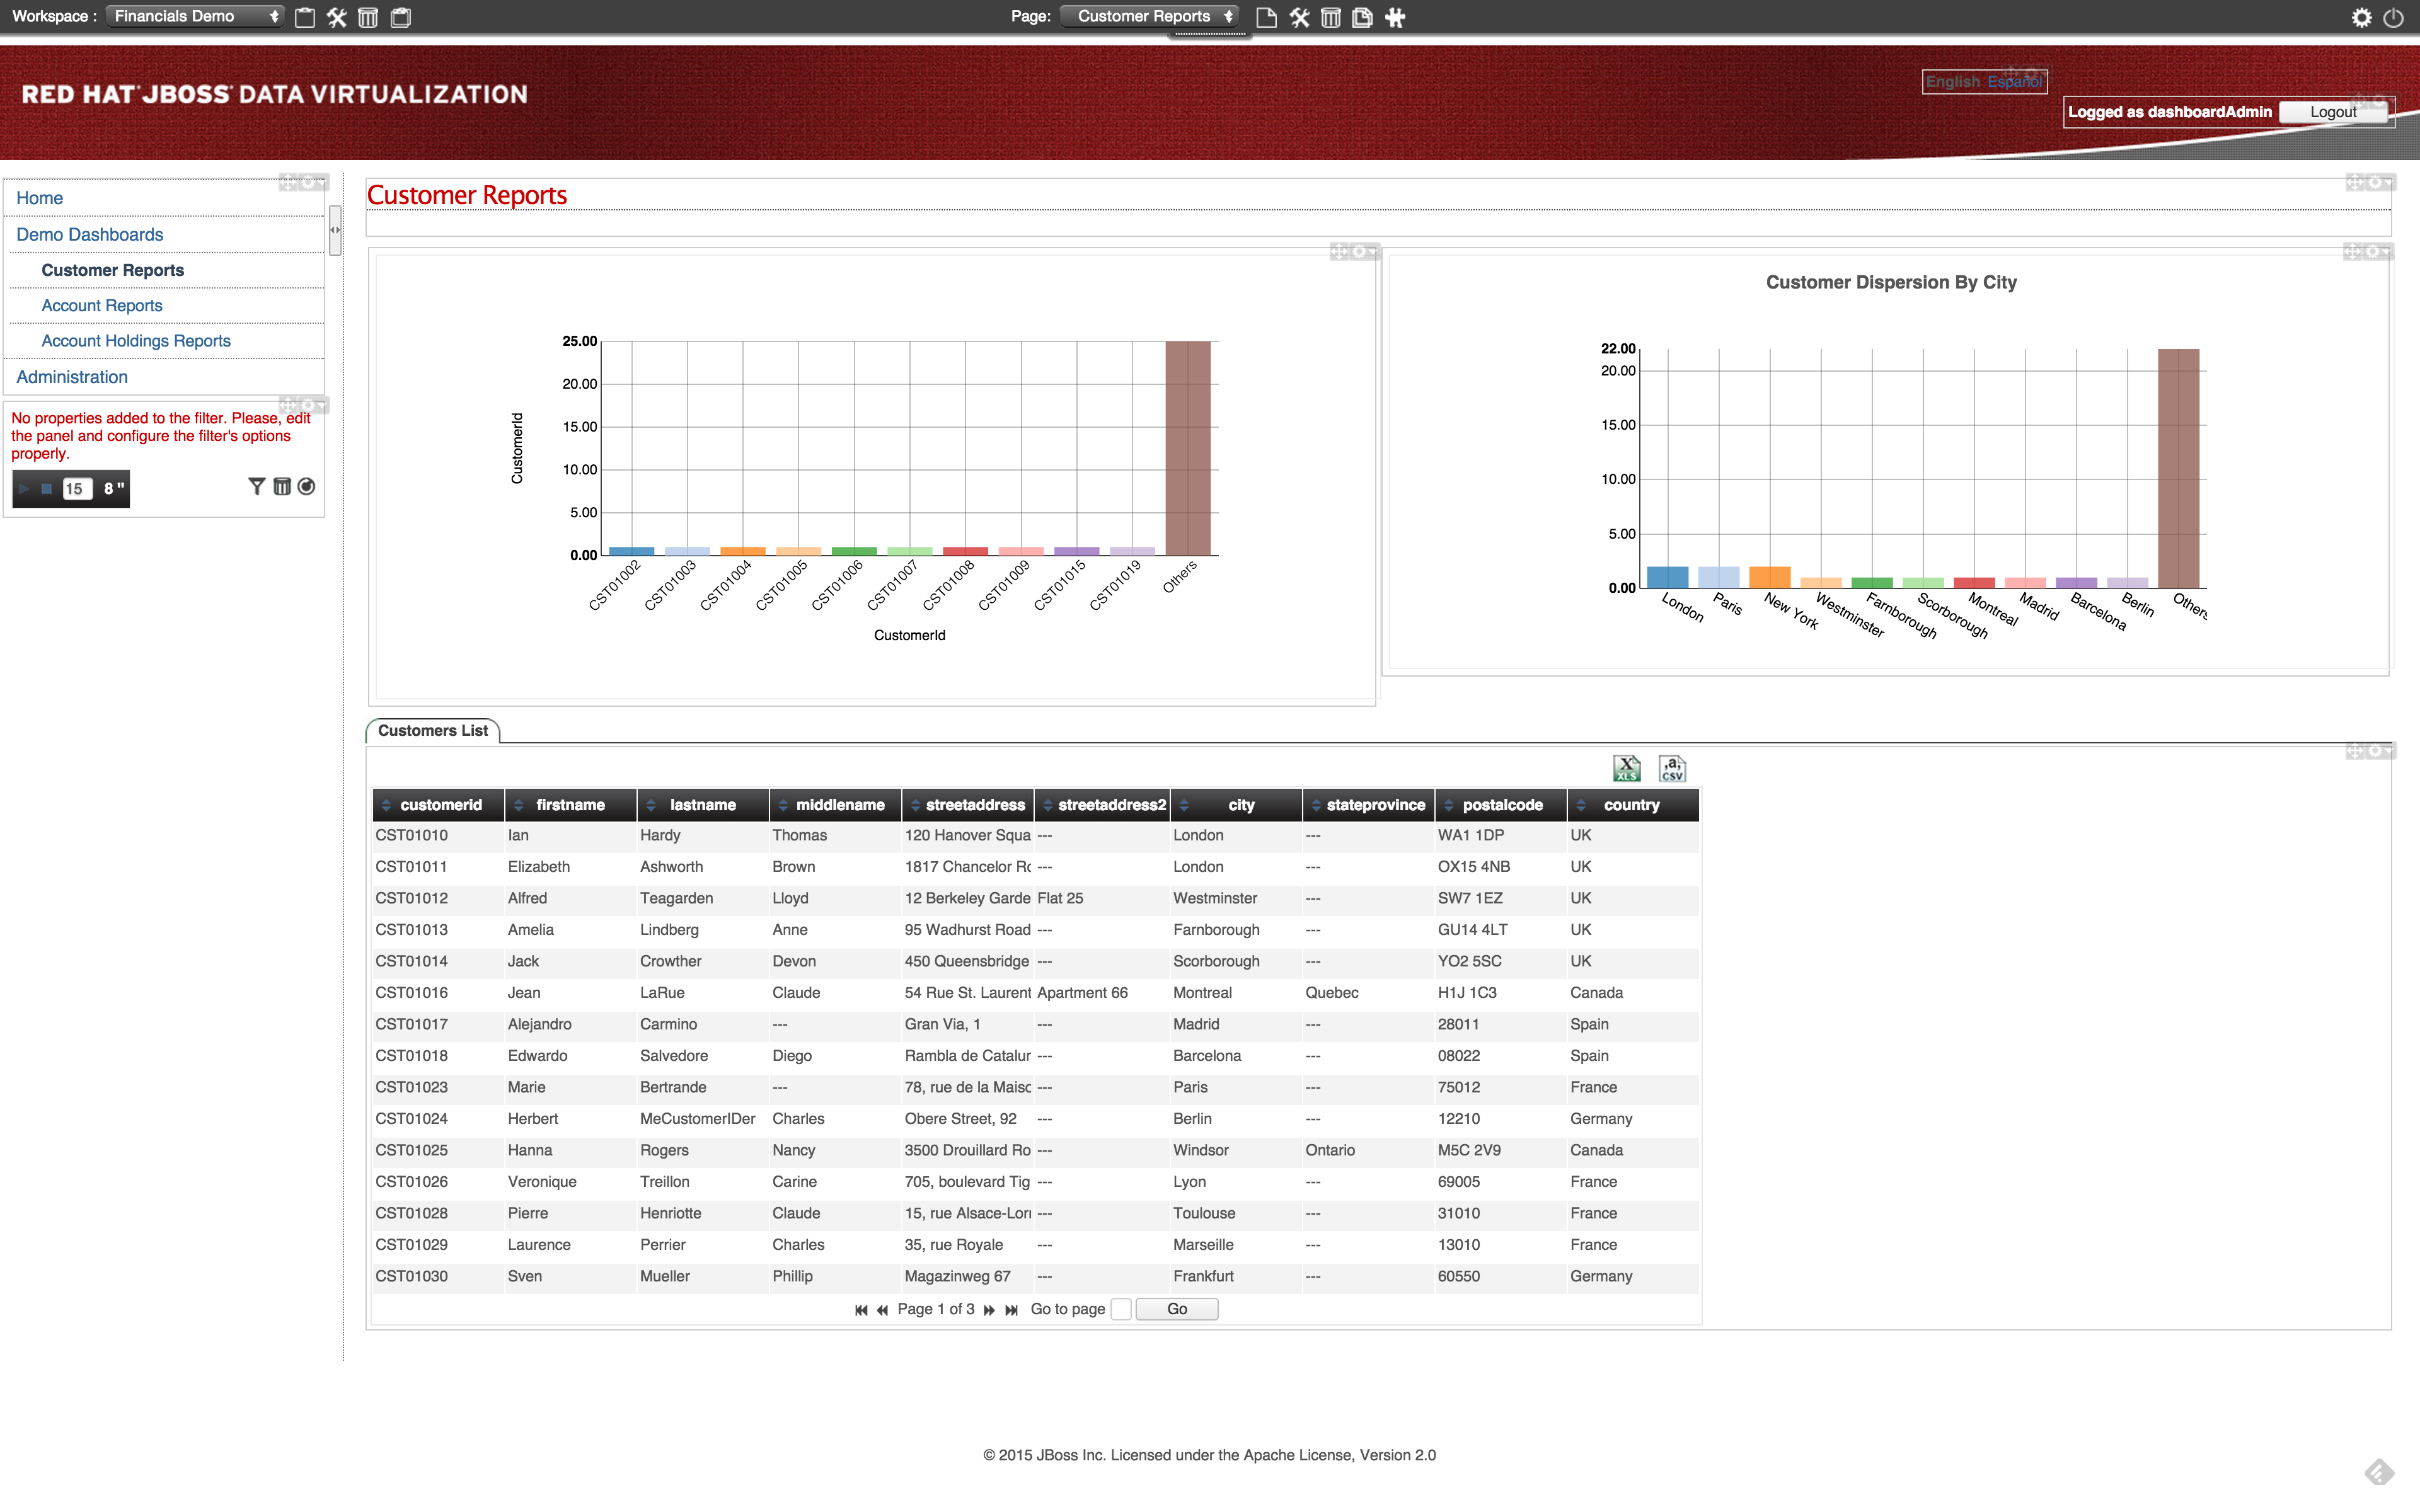
Since we imported the workspace and the corresponding dashboard into the Financials Demo workspace we can now show the dashboard. Select the Financials Demo workspace as the active workspace. In the navigation menu select menu:Demo Dashboards[] and in this menu option we should have three menu items.
-
Customer Reports
-
Account Reports
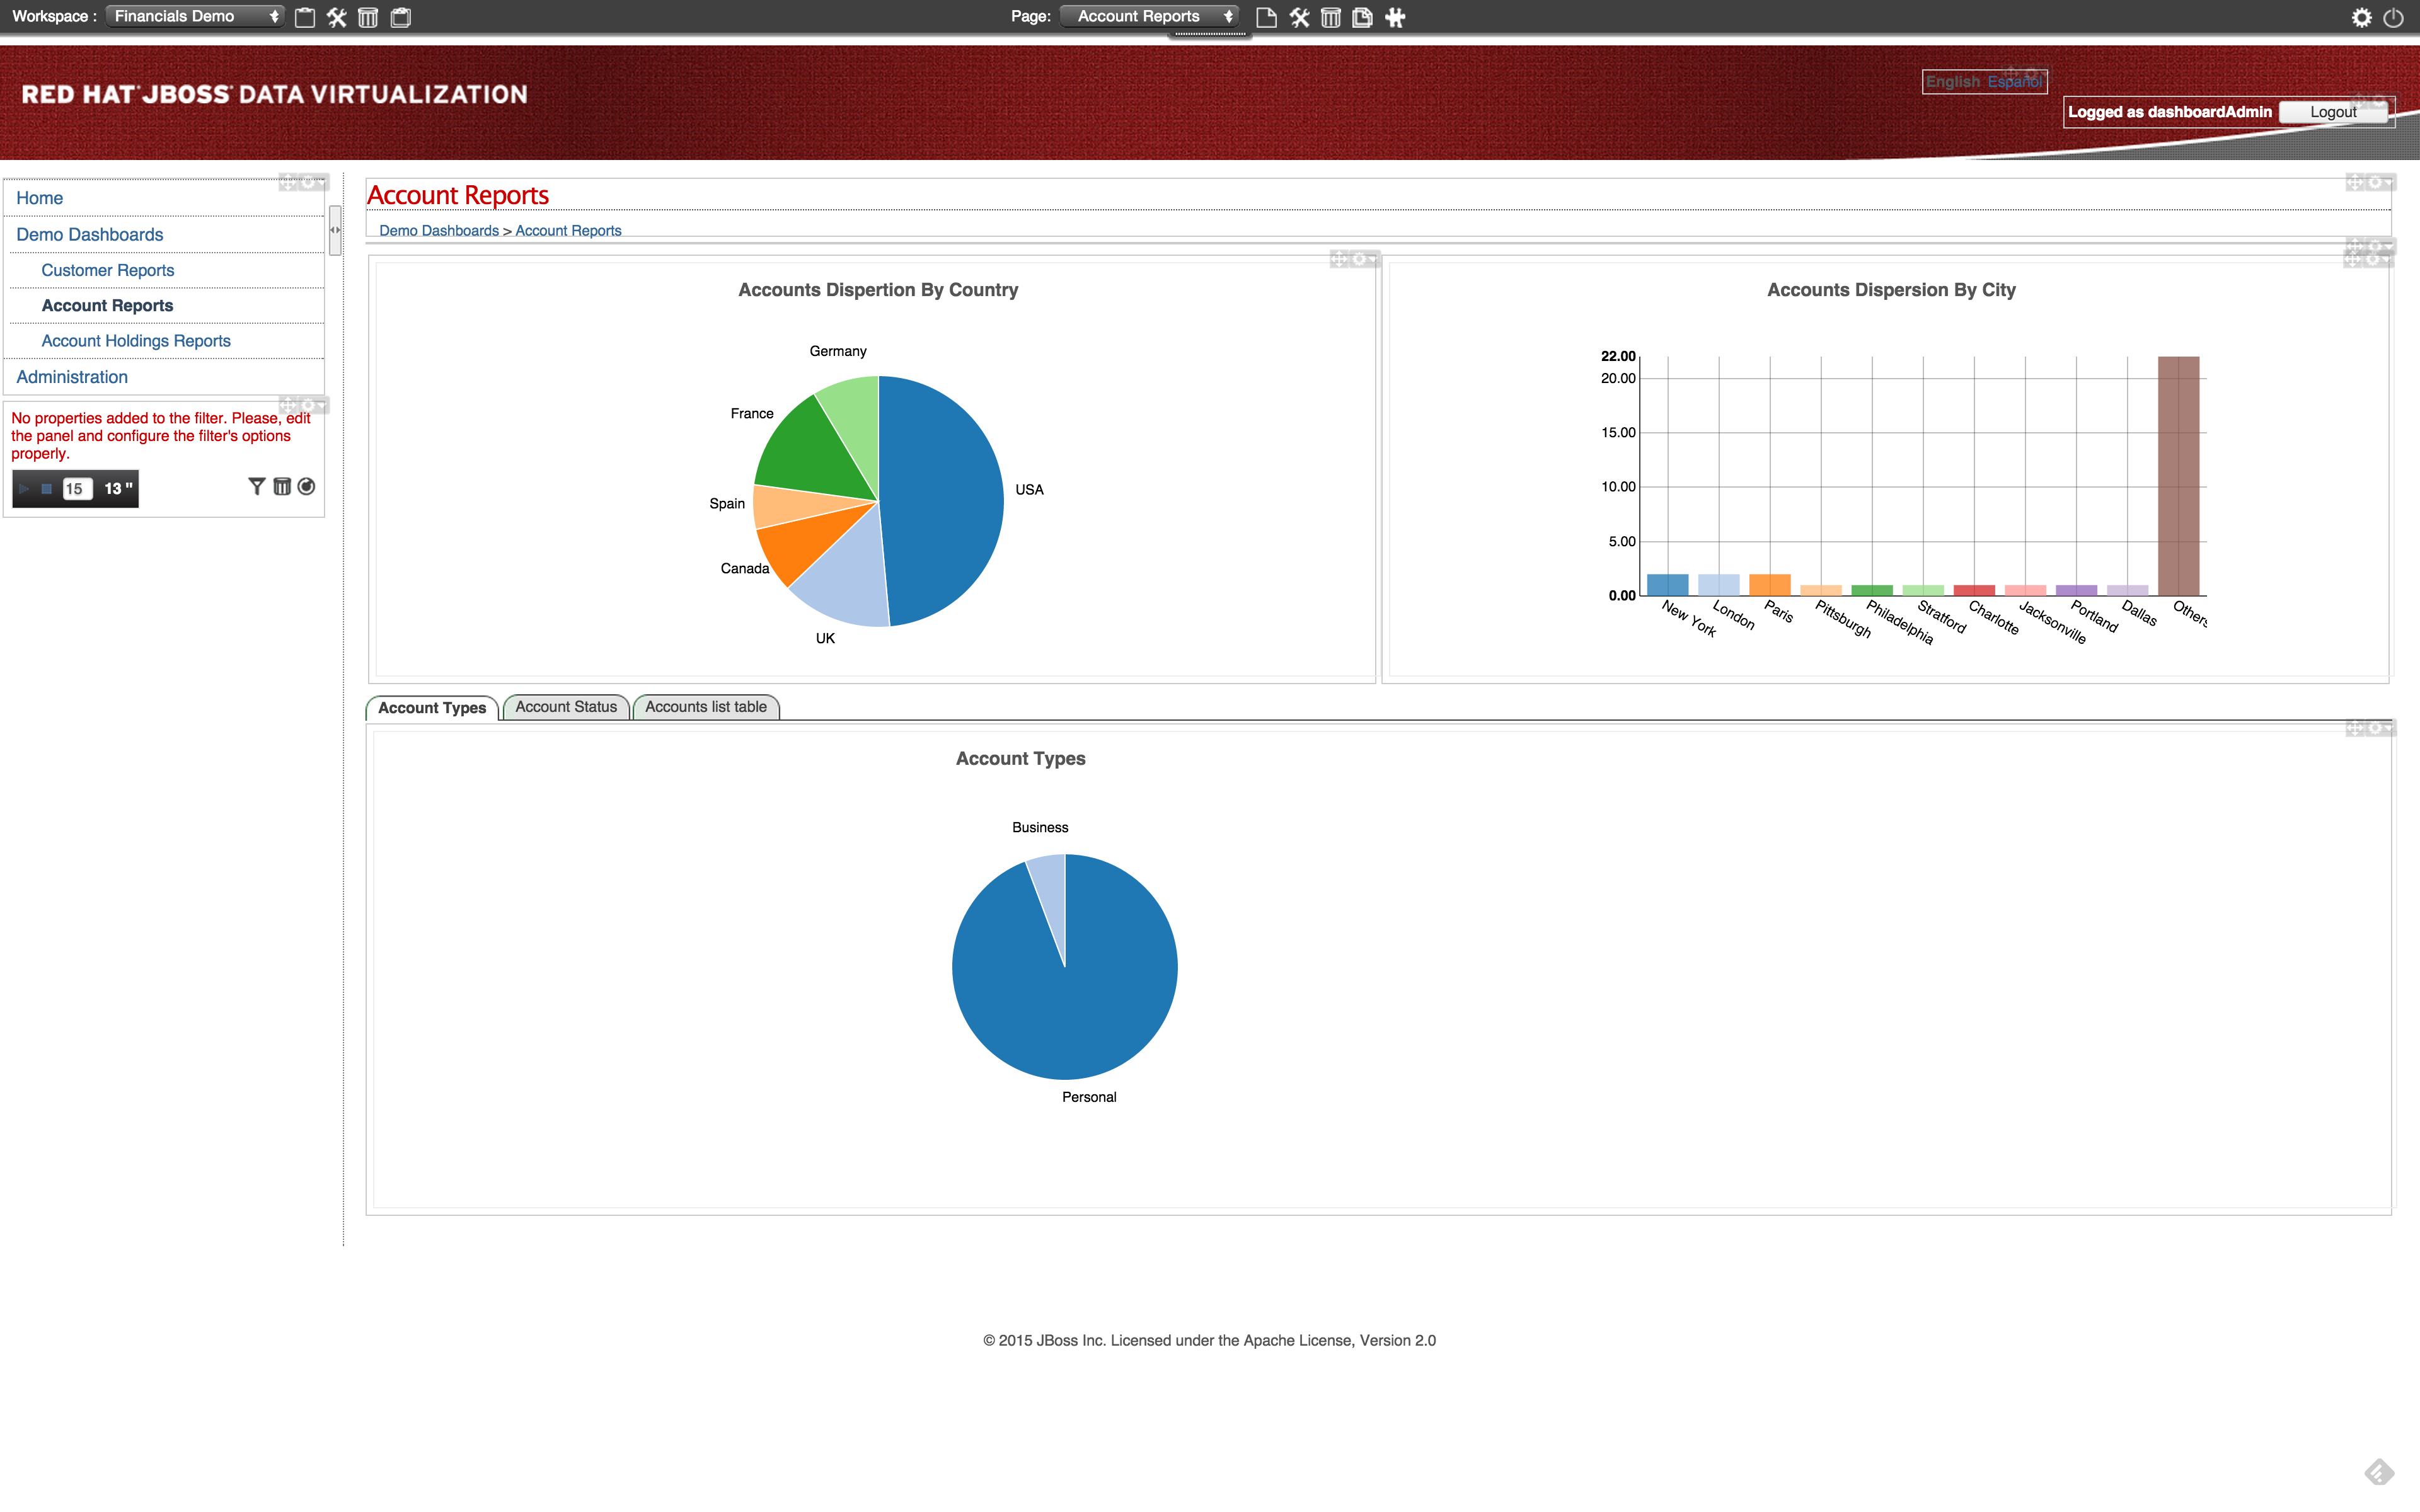
-
Account Holdings Reports
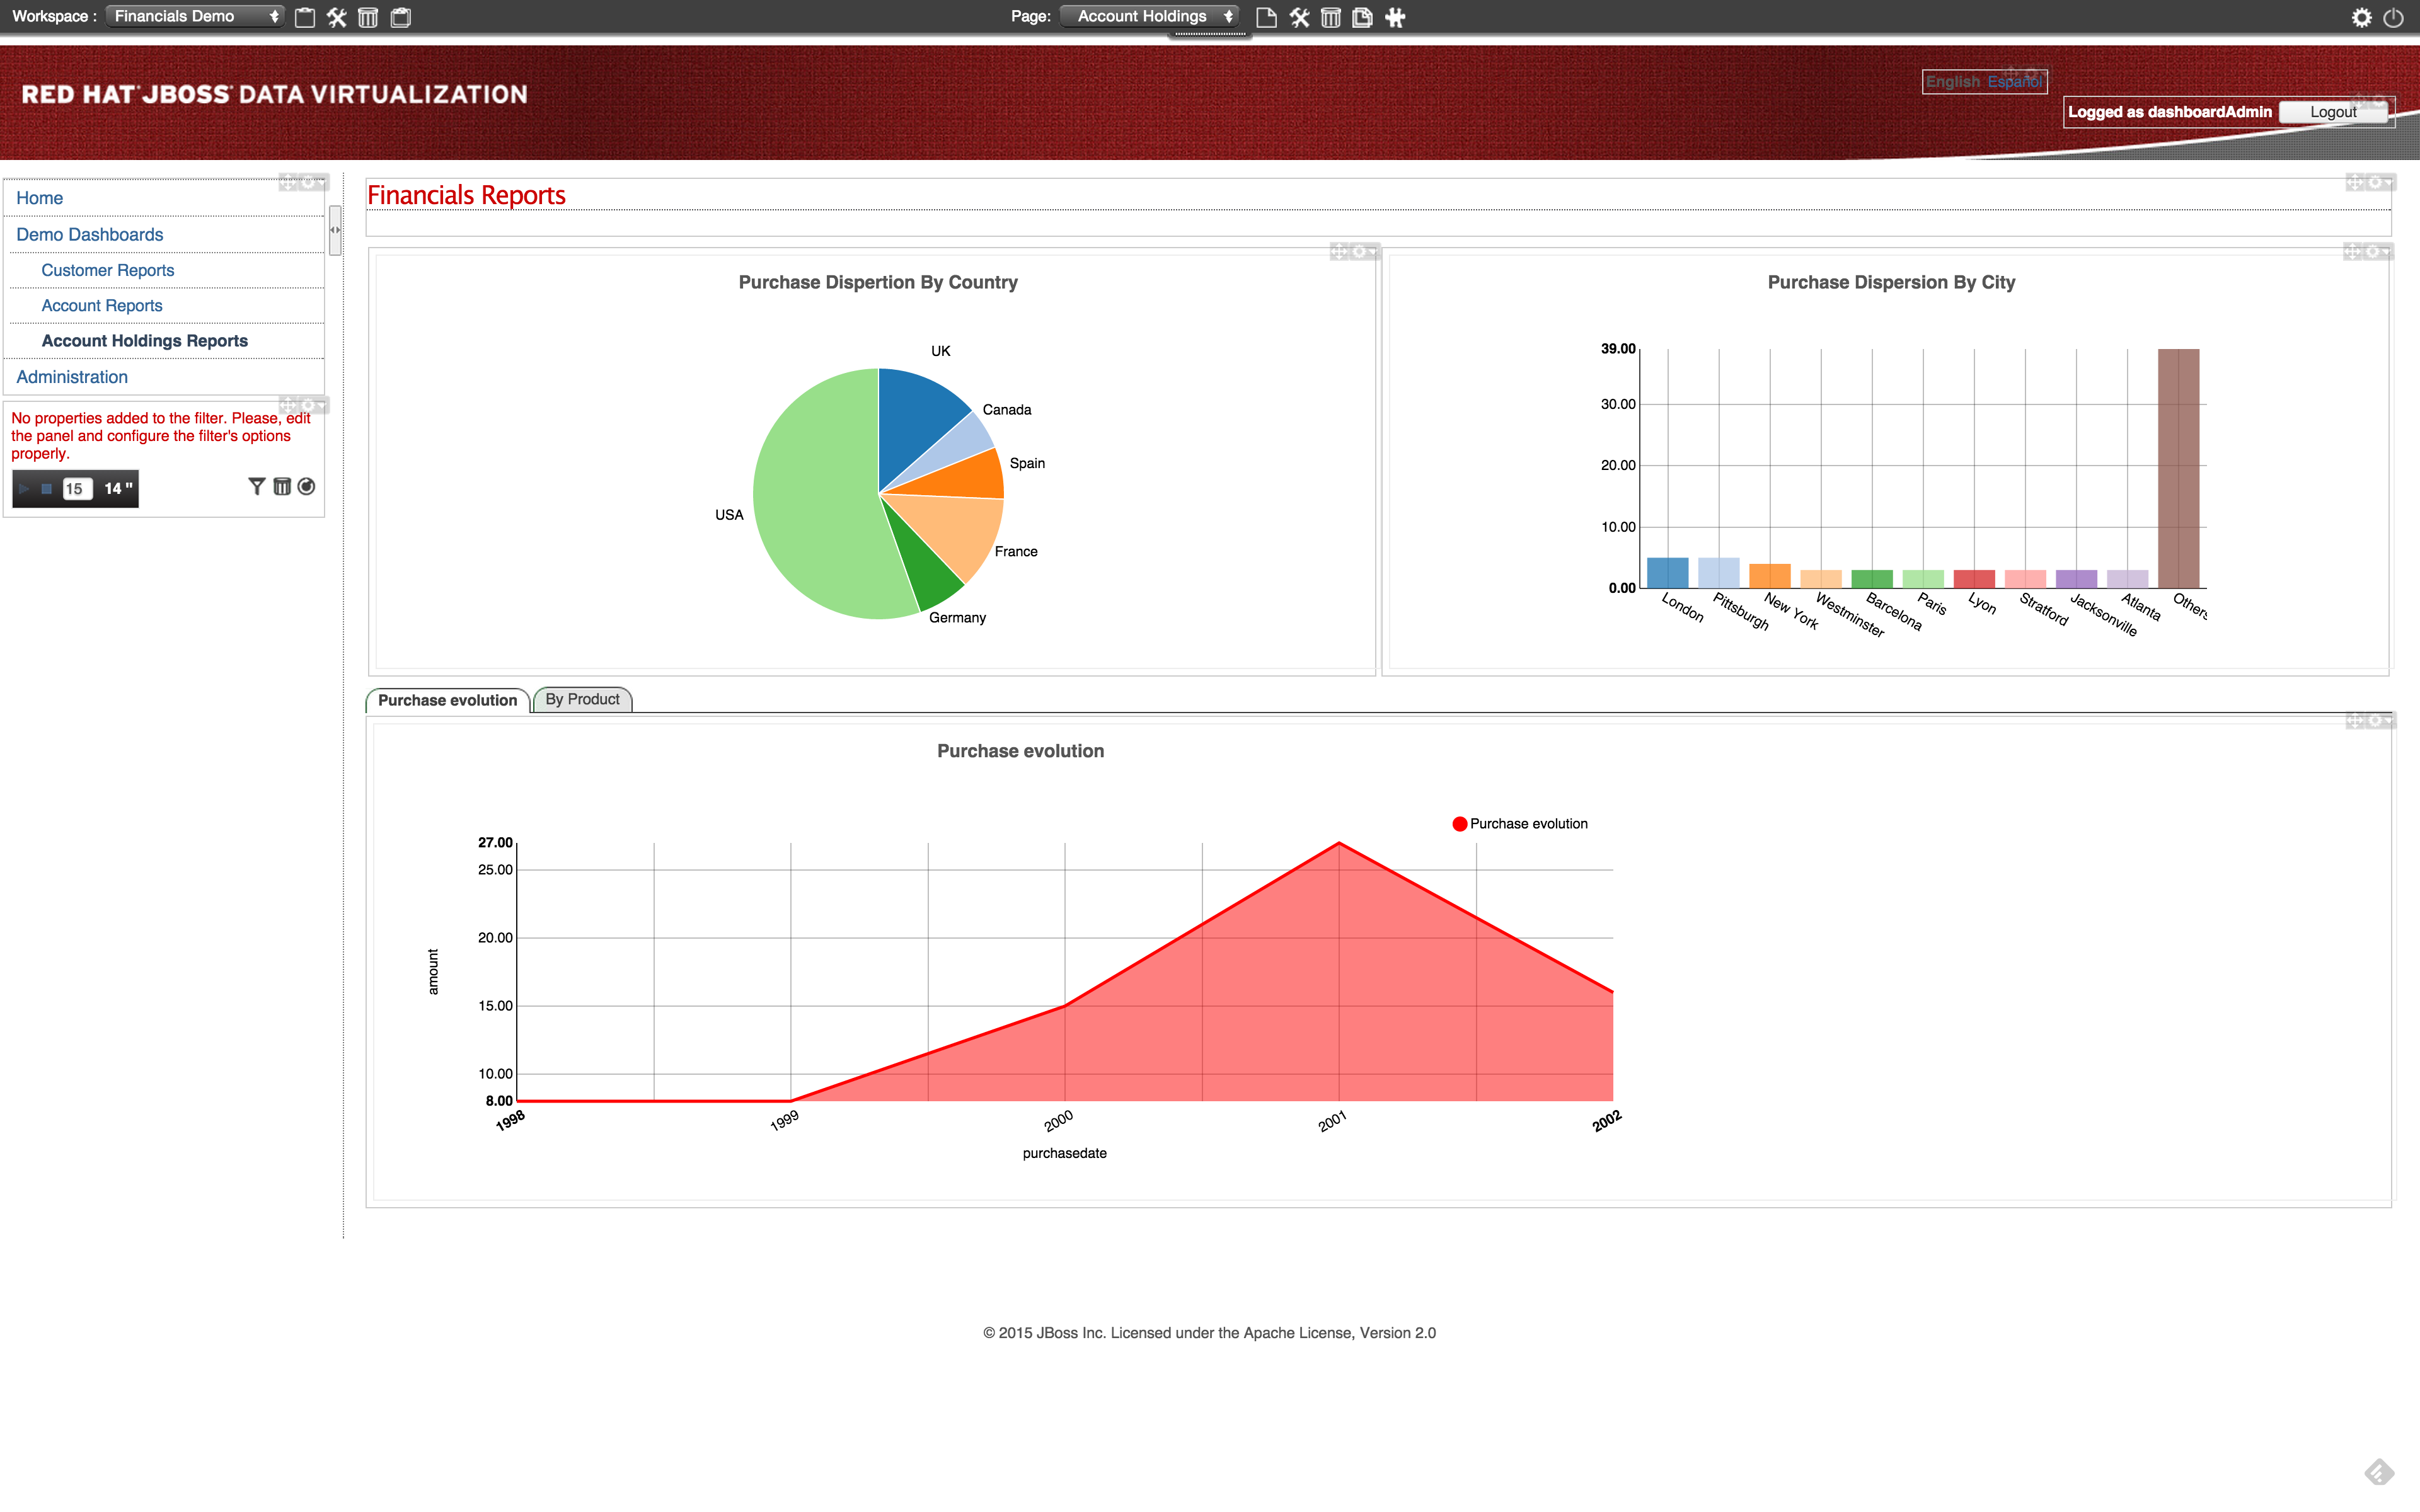
Navigate through the dashboards and discover how it is setup. Dashboard Builder provides a very easy way to visualize your data.
Congratulations, you have now completed this lab.